
Ancera Post-Harvest Mobile App
Making food production more secure, efficient, and profitable by replacing guesswork with data and decision simulations.
Lead UX Designer & UX Strategist
~ 1 Year
Role & Duration
Tools
The Problem
The poultry industry’s process for detecting diseases and preventing outbreaks lacks efficiency and exacting accuracy, forcing technicians to either spend too much time visiting the farms and factories they purvey, or relying on gut instinct alone—often resulting in costly product recalls.
Ancera’s Post-Harvest app was created to help Food Industry technicians make high-risk decisions by providing them with the data they need at their fingertips, saving them time and money.
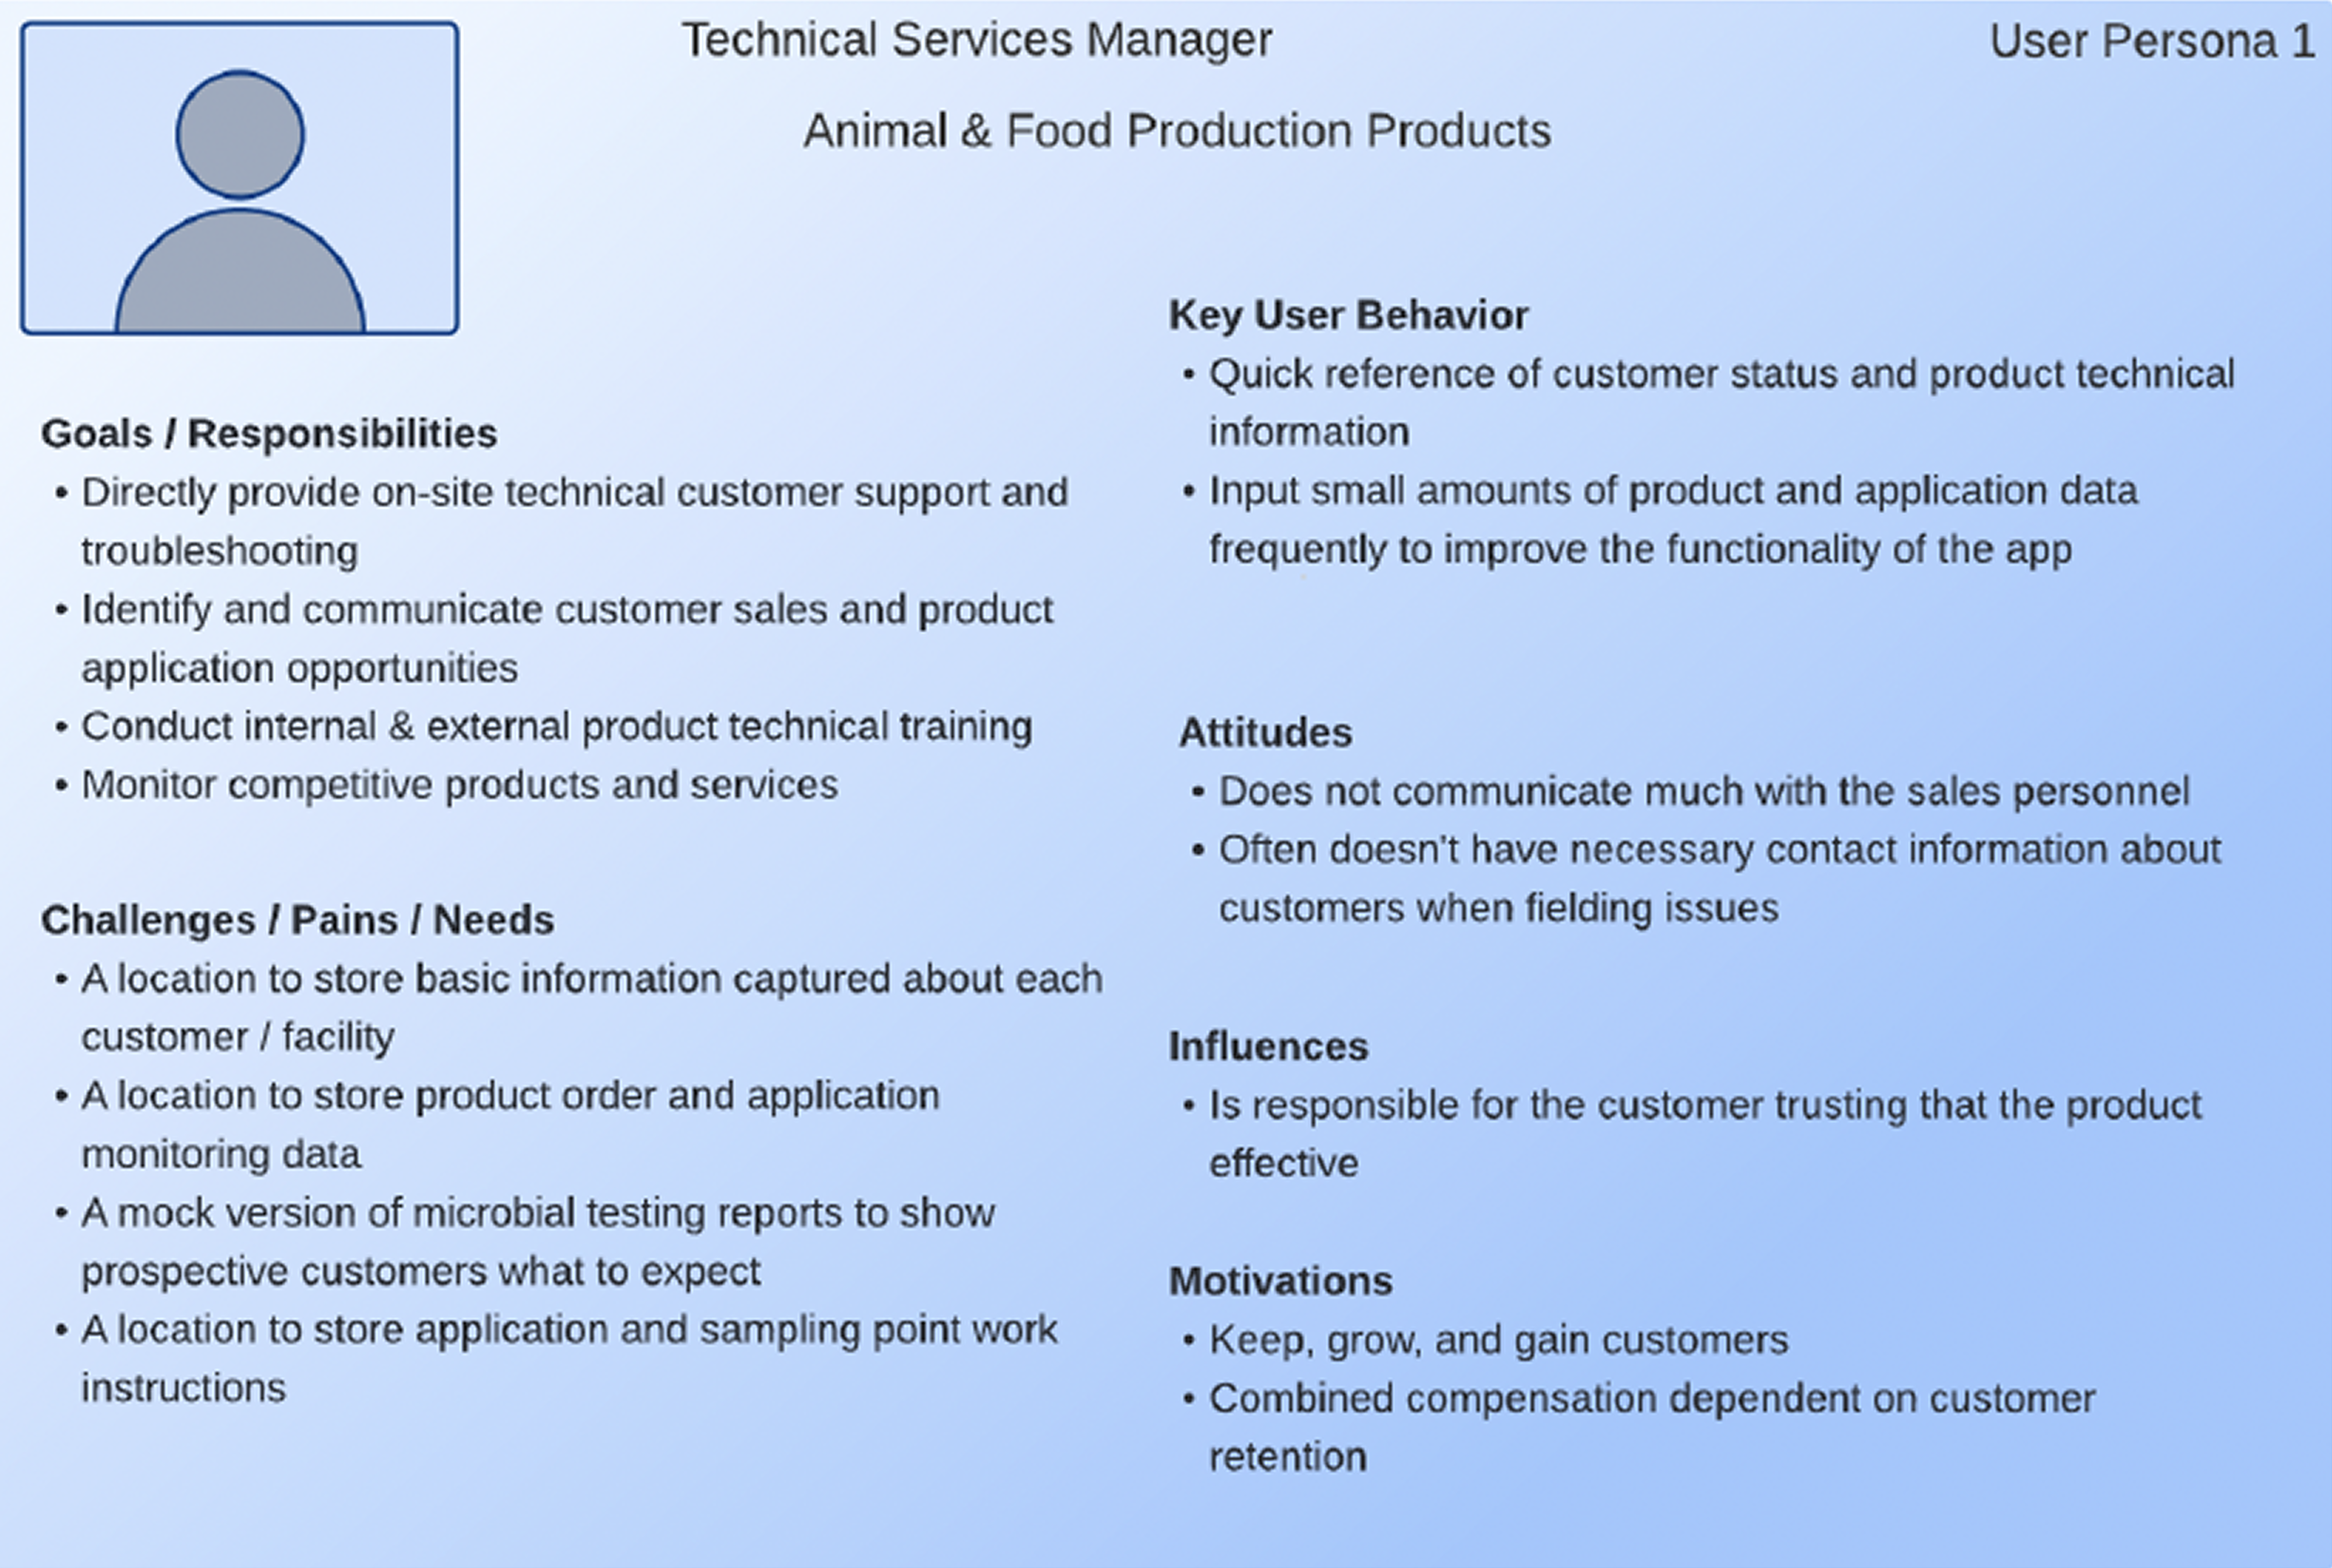
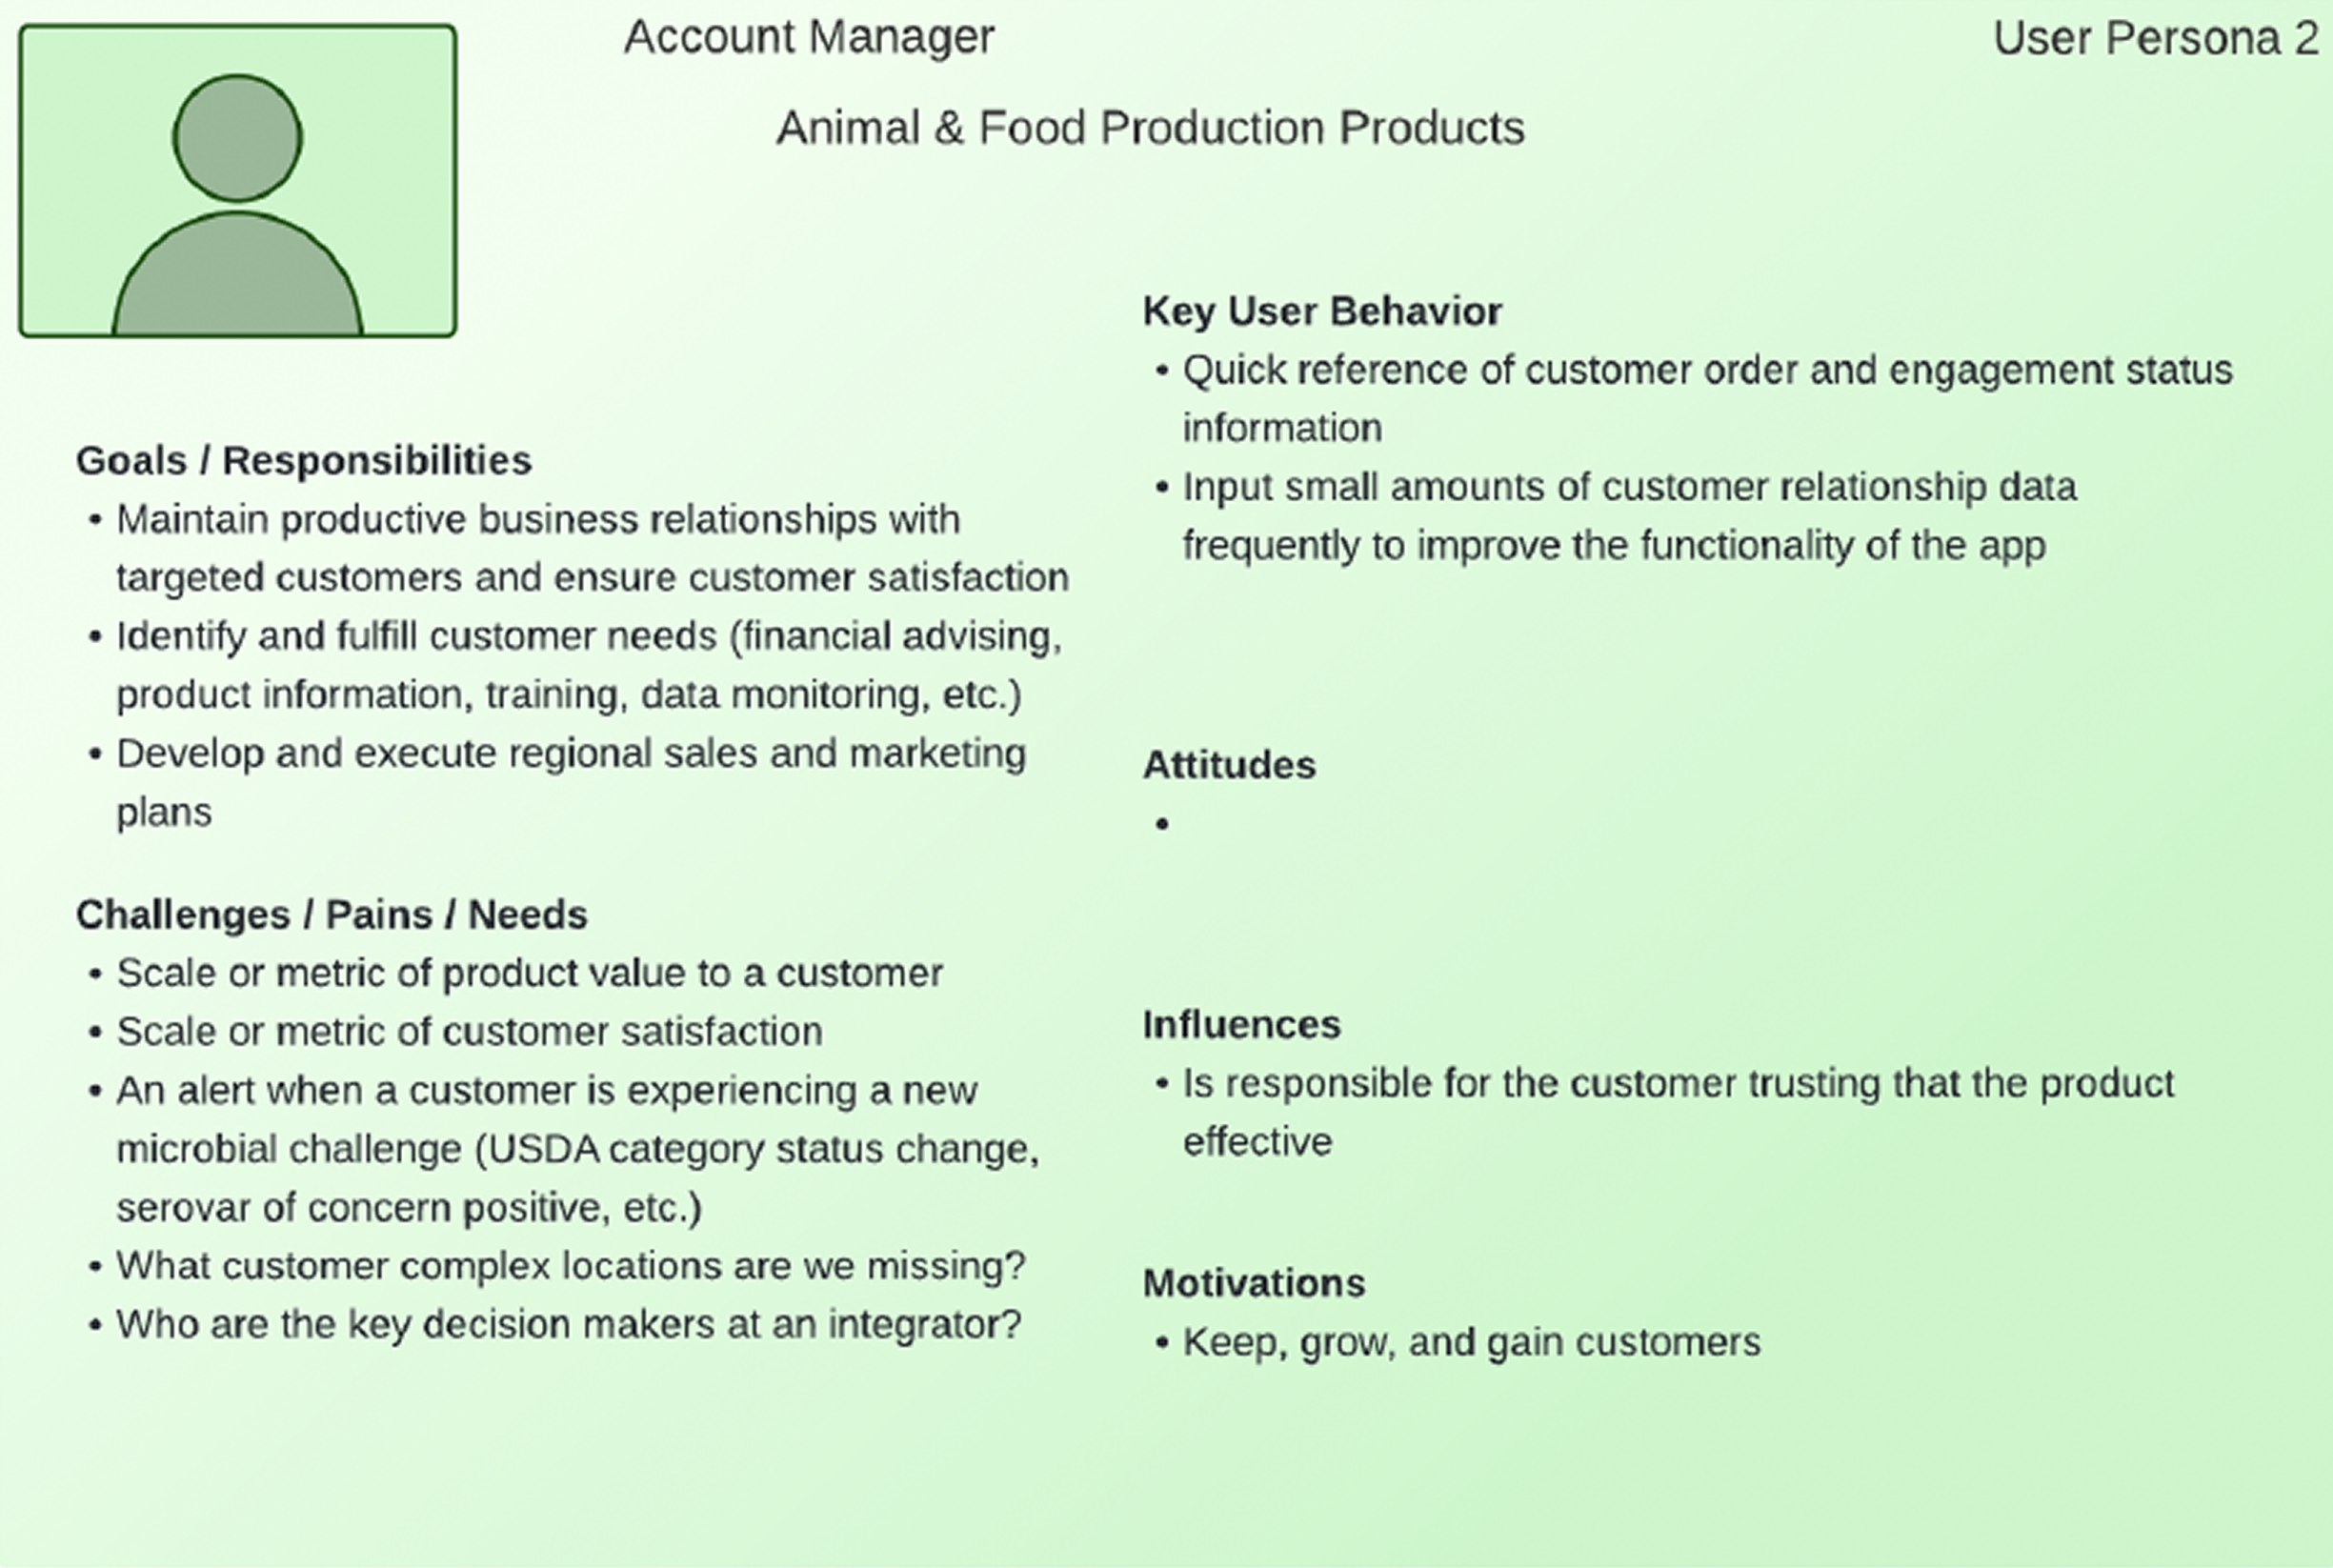
The food industry technicians we aimed to serve may work as Sales Representatives, Supply Chain Managers, Biosecurity Specialists, Flock Supervisors, or Quality Assurance Officers.
The differing needs of users within these roles created a challenge for feature prioritization and information architecture.
How can we serve these user groups simultaneously while presenting complex data?
Users & Challenges
Initially, I was expected to simply translate the CEO’s specifications into clean UI. As the first UX practitioner in the company, I advocated for user interviews, or to at least be brought on to stakeholder meetings. Though I was being the “squeaky wheel” as asked, to identify areas for growth and product refining, my advocacy ultimately was rebuffed, as leadership felt they knew the users already and wanted me to execute the desired design, no questions asked.
After delivering what was asked for, our stakeholders—who represented the user groups targeted—were not satisfied with what was presented, feeling that what they needed wasn’t being addressed and what was present wasn’t priority.
Leadership then brought Product Managers onto the project, one of whom was previously one of their R&D Engineers.
With the new leadership on this project, I re-attempted my advocacy for deeper user understanding.
I was then able to lead them in user research exercises and workshops such as:
User profiles/personas to clarify user types and goals.
Whiteboard workshops, such as user flows, user journeys and feature prioritization, to identify key user questions and tasks.
Problem reframing exercises: not “What can we build?” but “What decisions are users trying to make? How can we make the decision making process easier?”
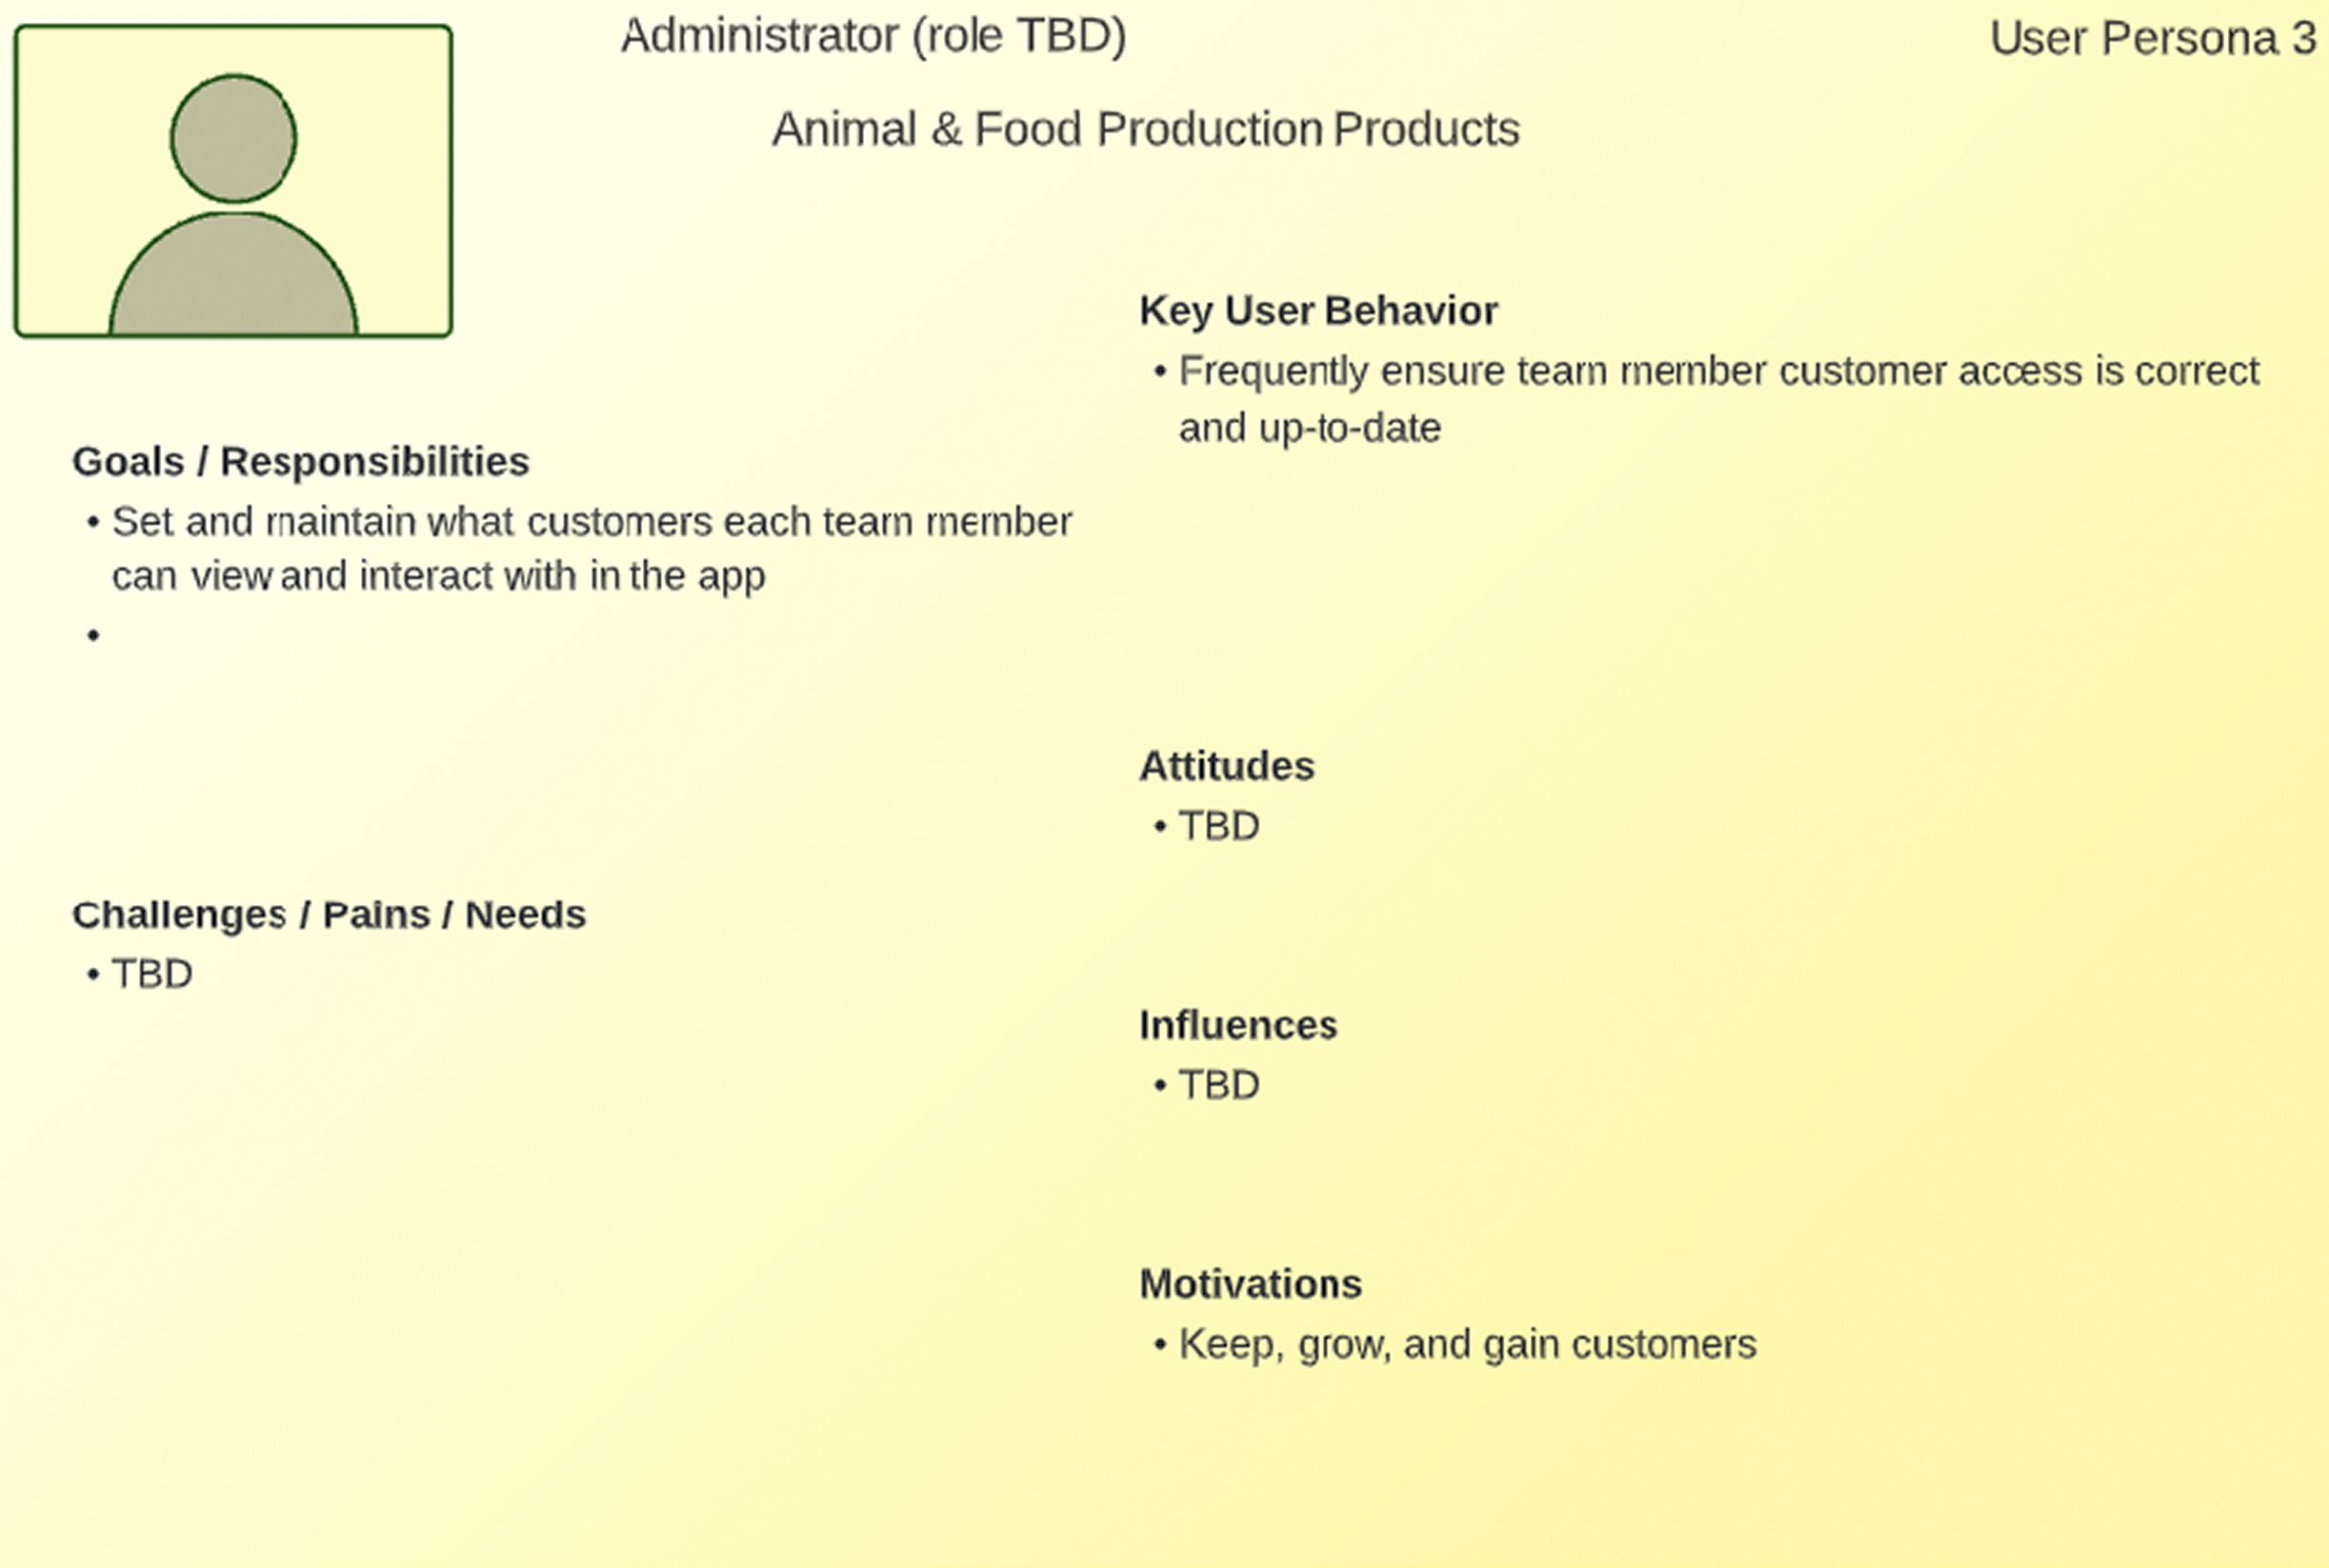
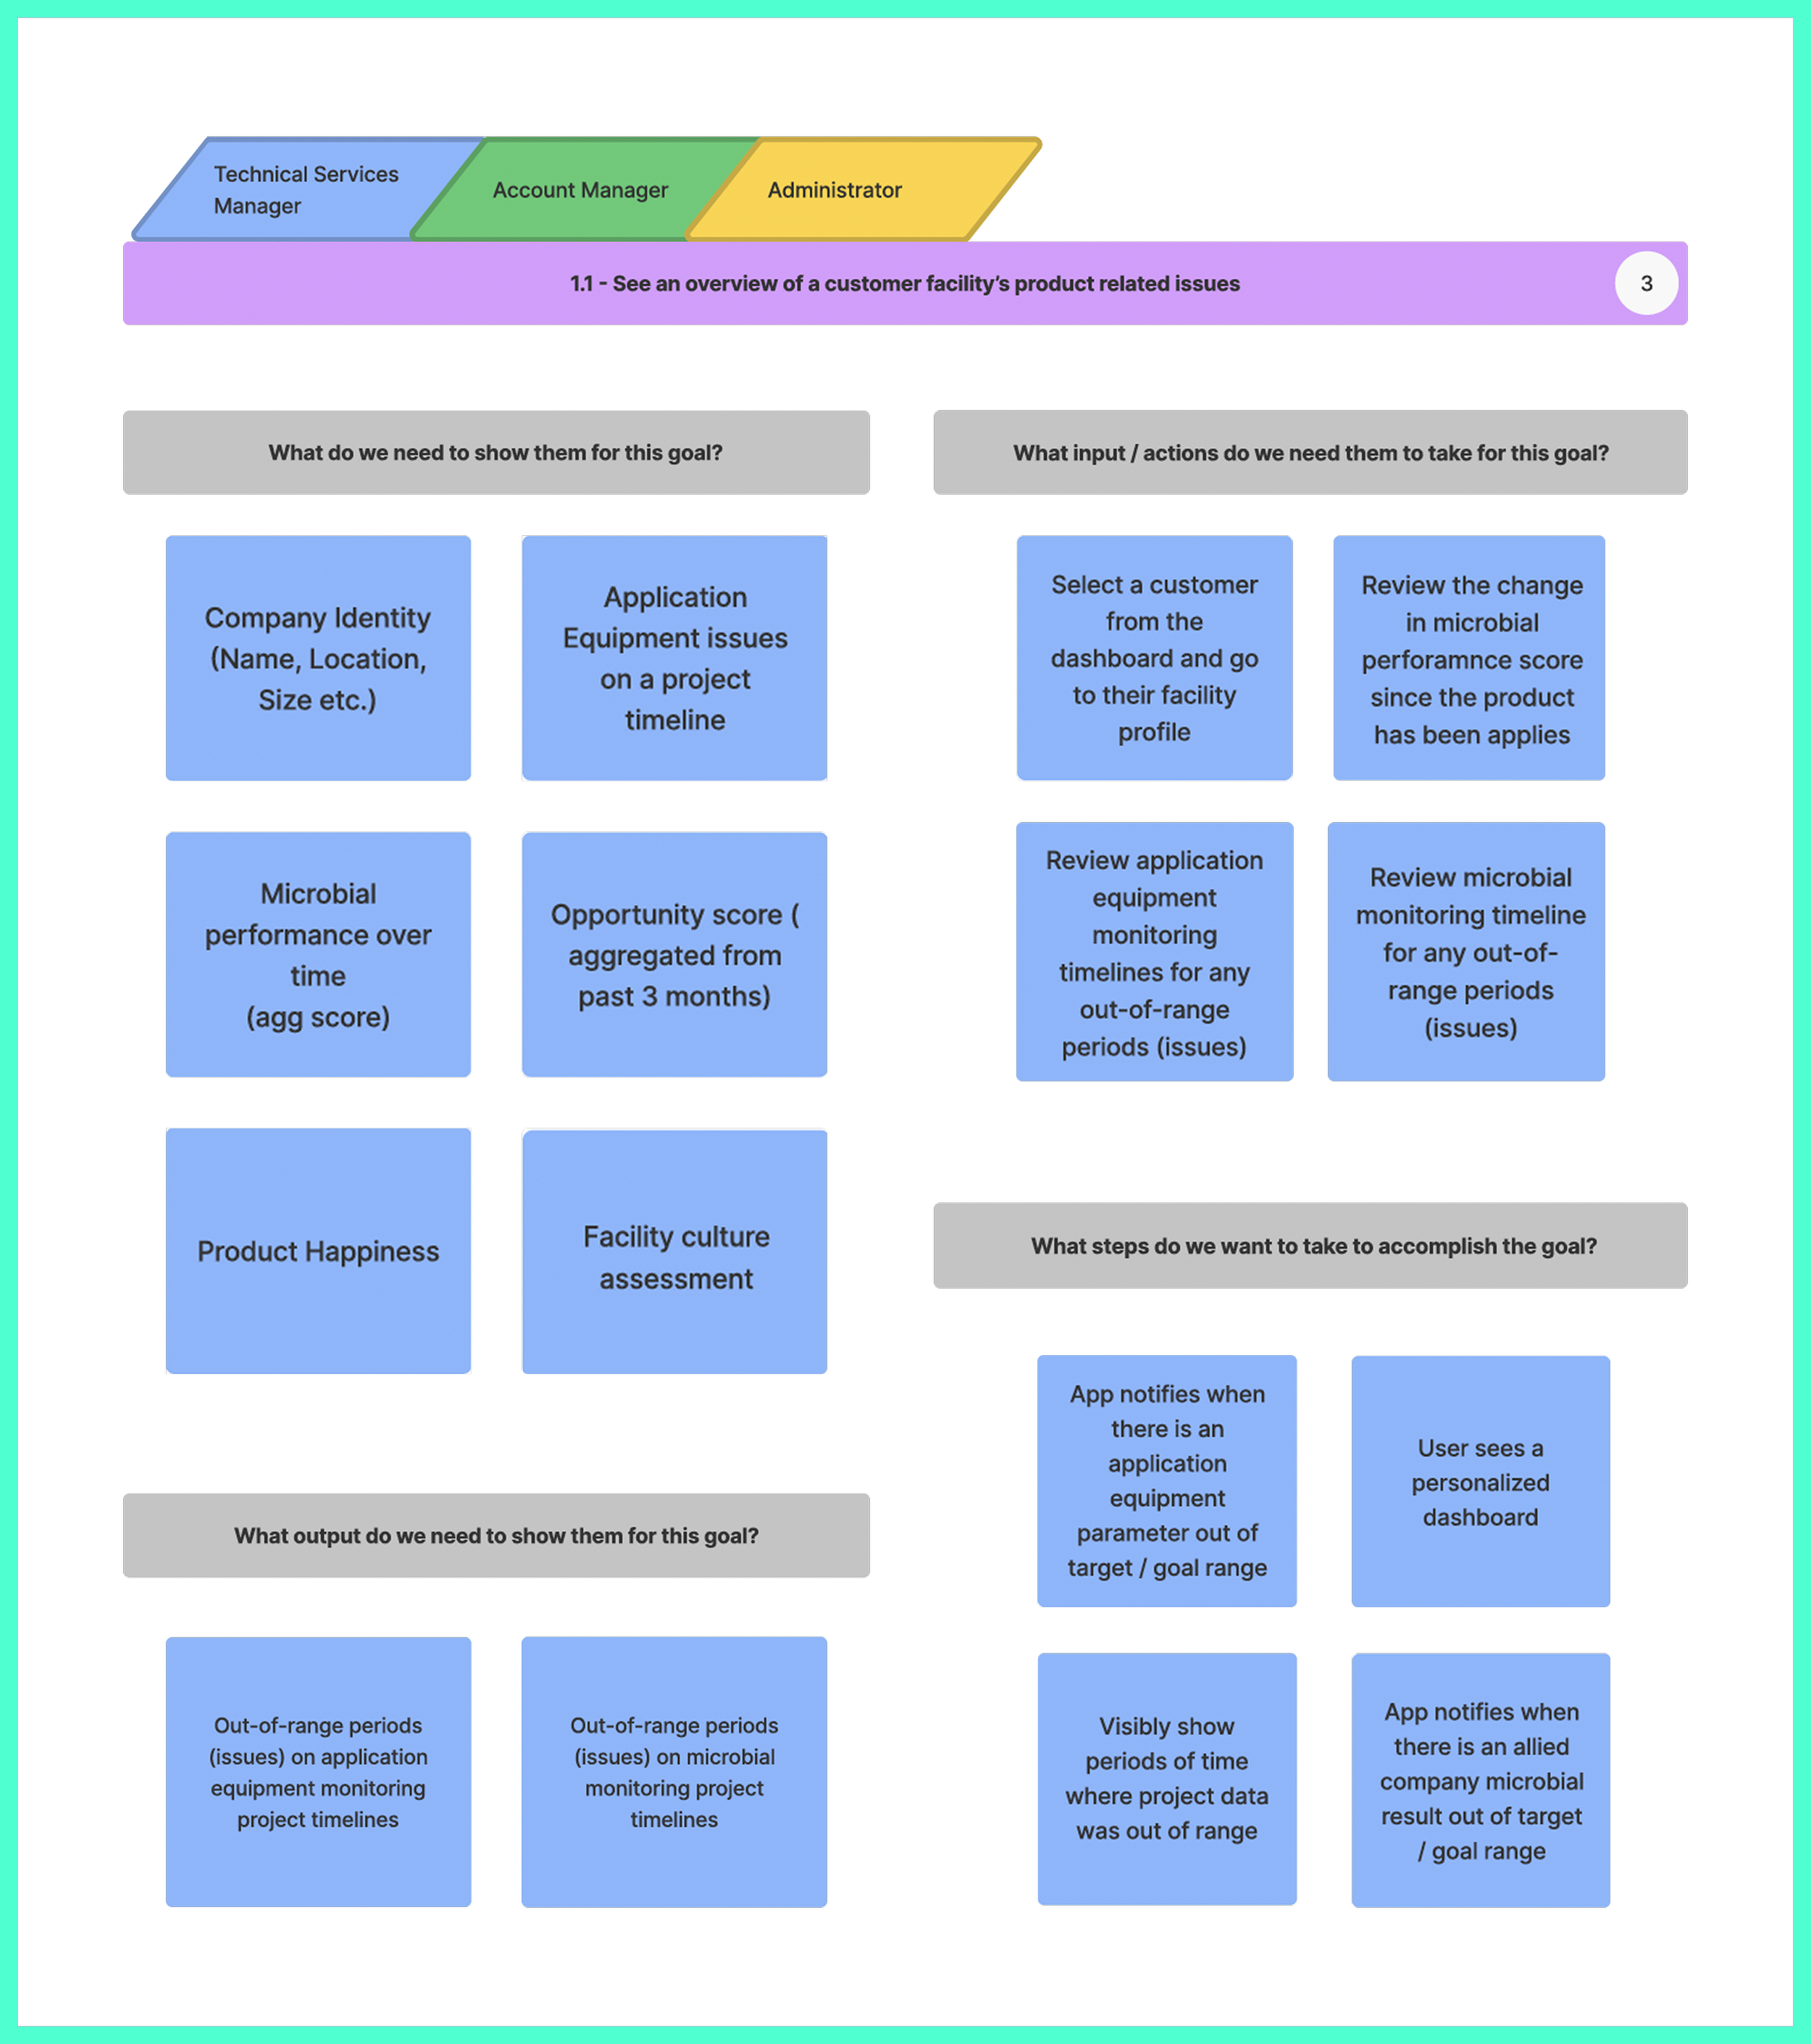
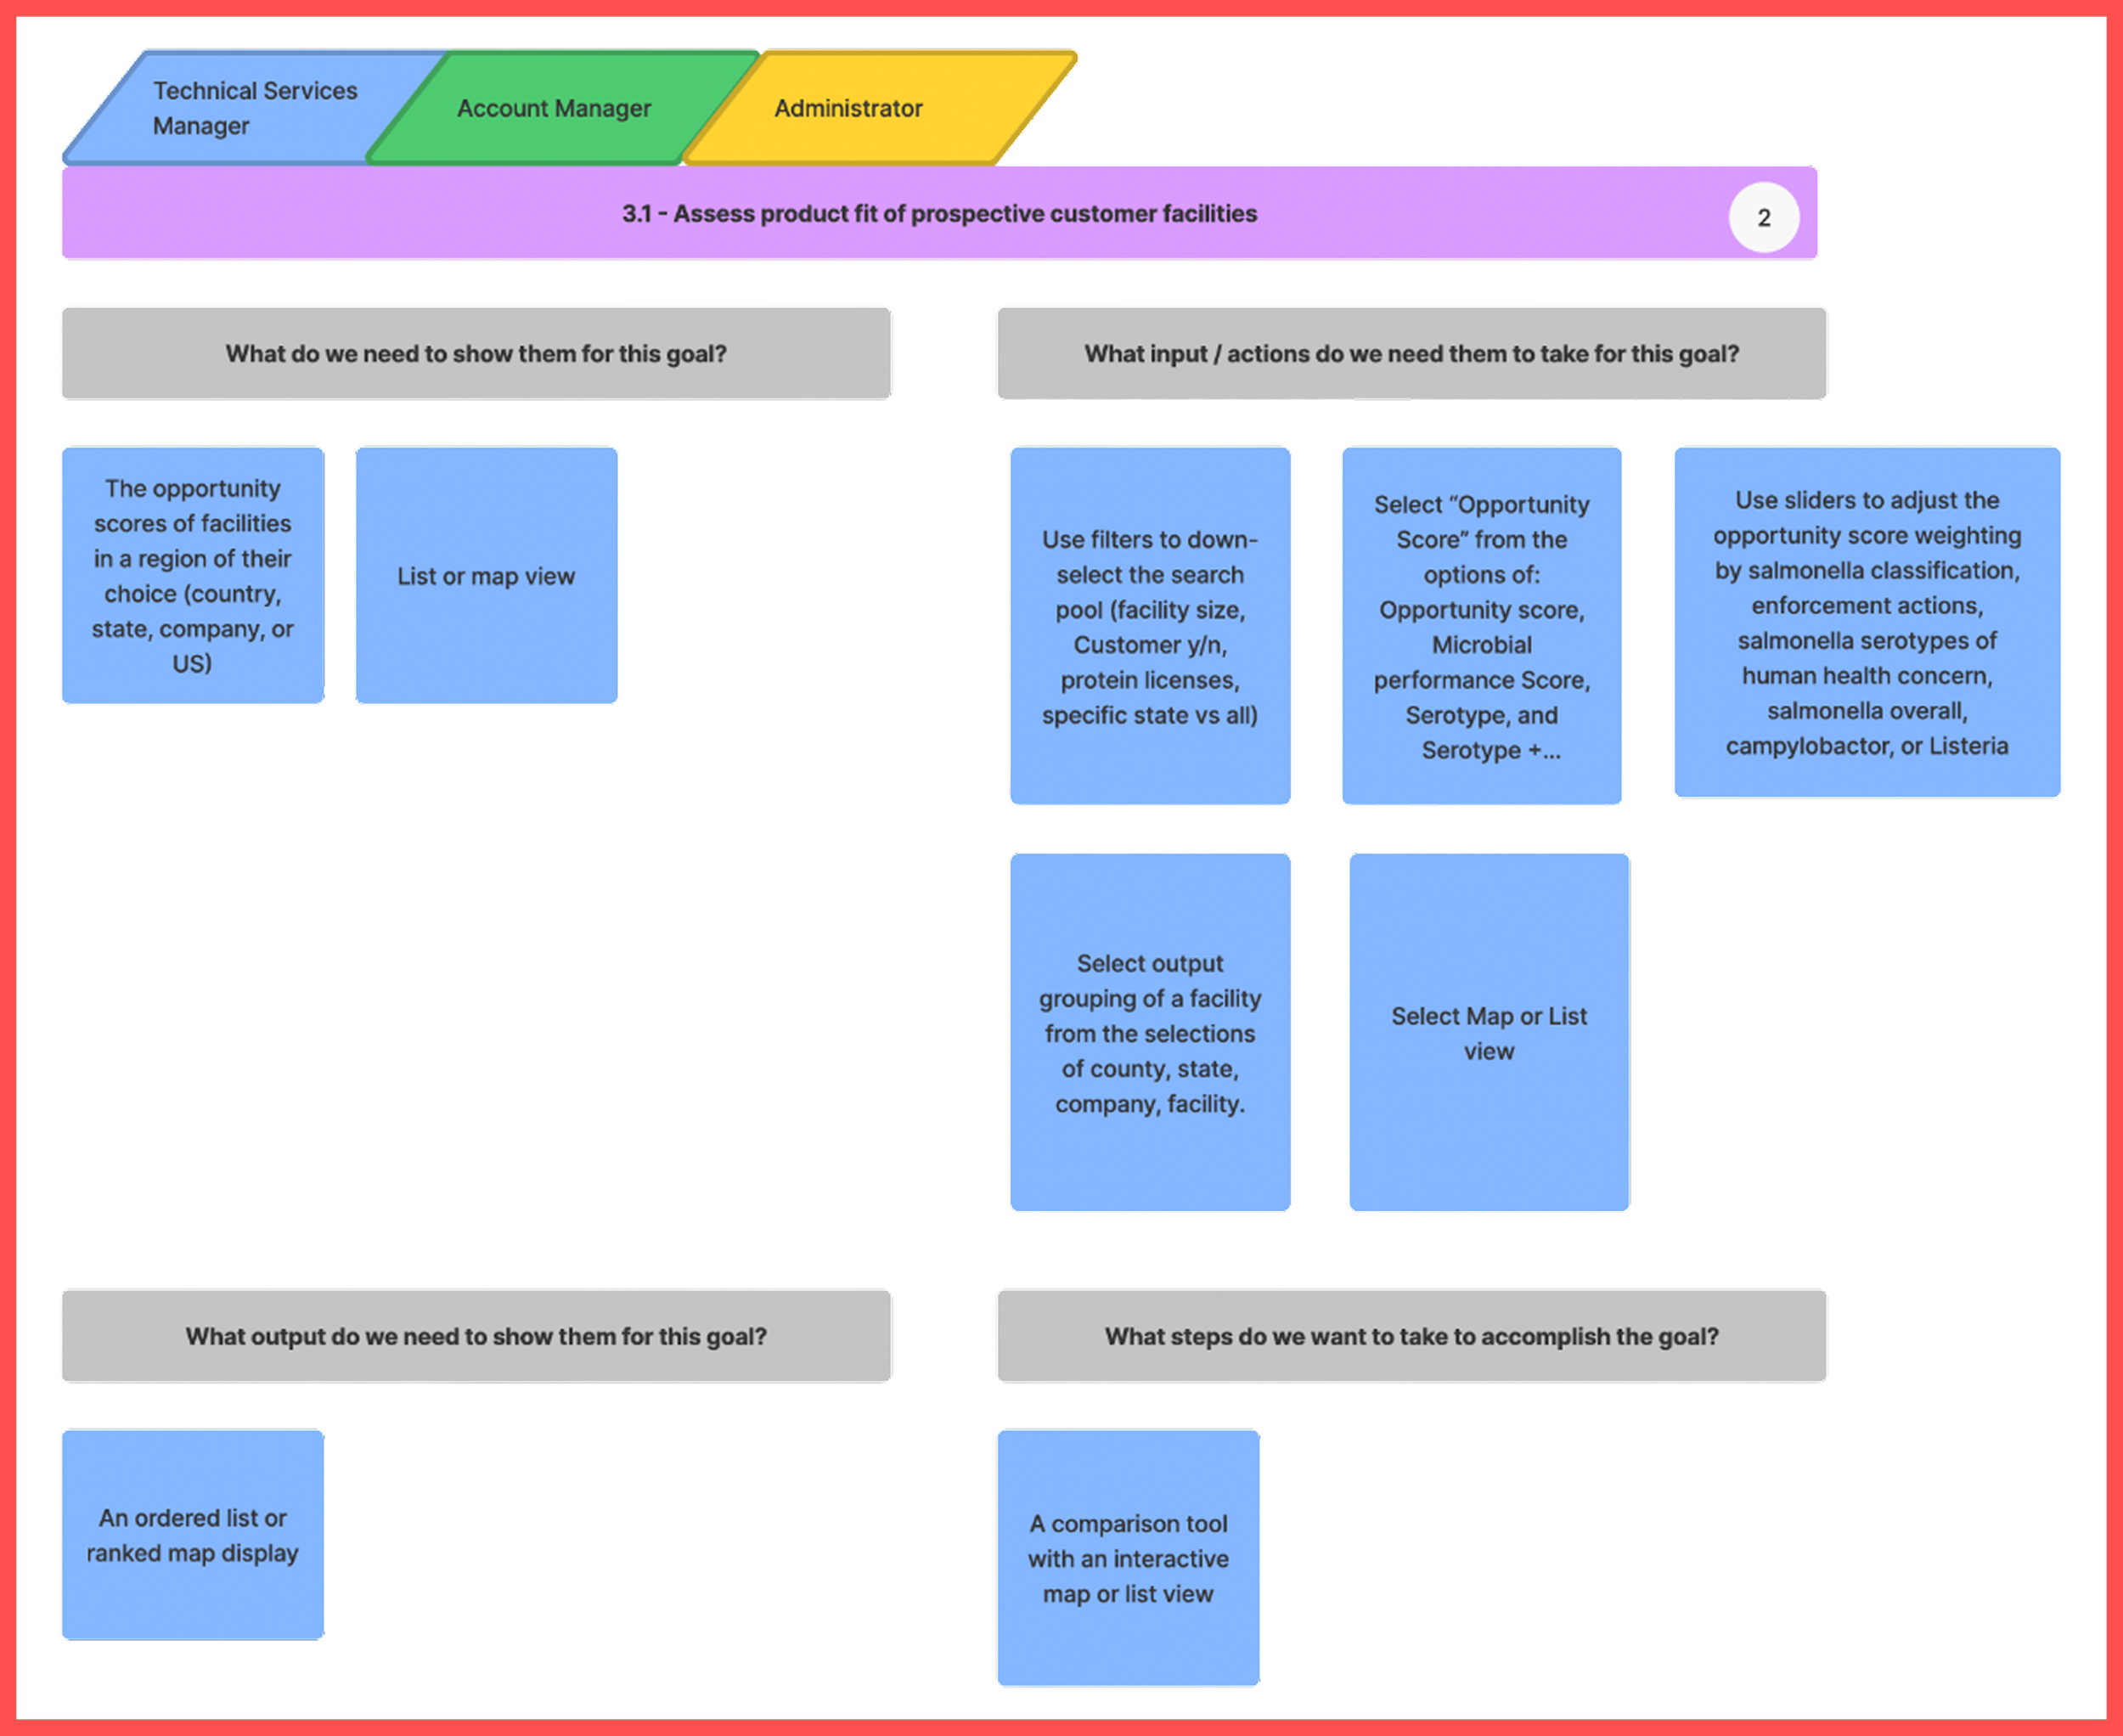
Through user stories we discovered 4 goals shared by all 3 user groups. The 2 most notable for feature selection and information architecture were: seeing an overview of a customer facility’s product related issues and assessing product fit of prospective customer facilities.
The Approach
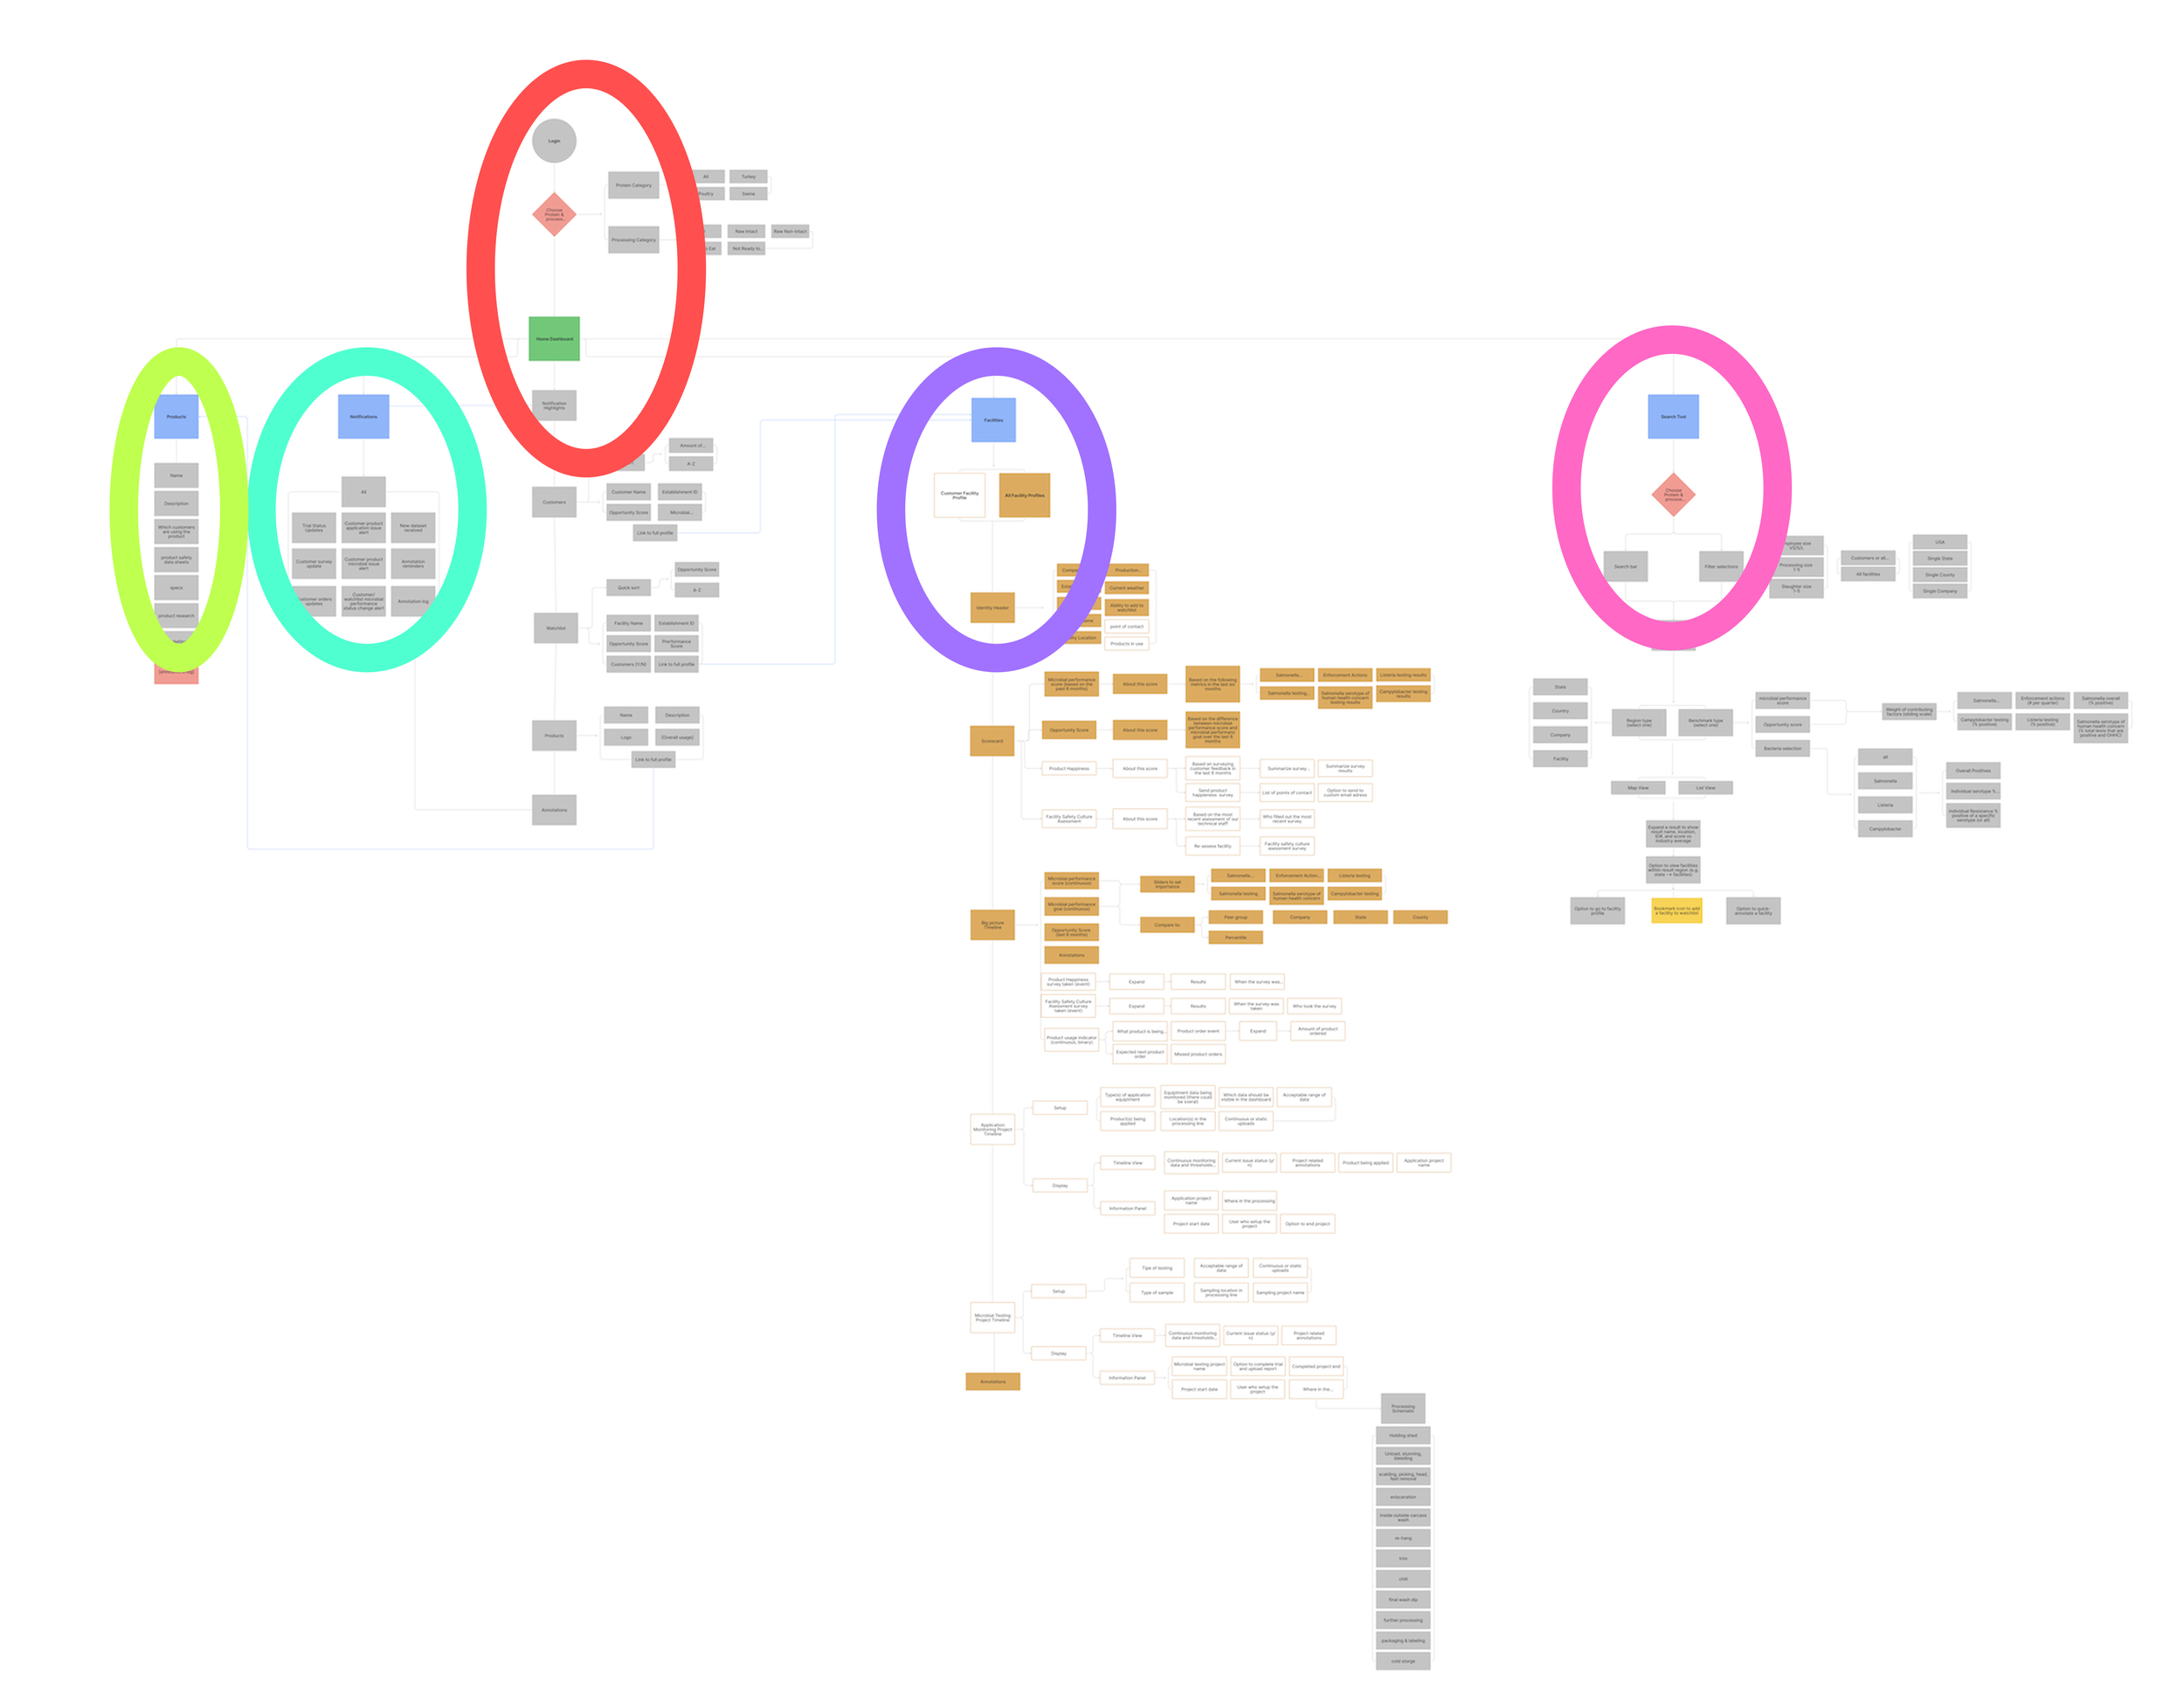
We conducted an information architecture exercise to figure out the structure and foundation of where all these features sit.
In order to satisfy the differing needs of our user groups, we created a dashboard with everything available in one shot including the following features informed by the user story exercise:
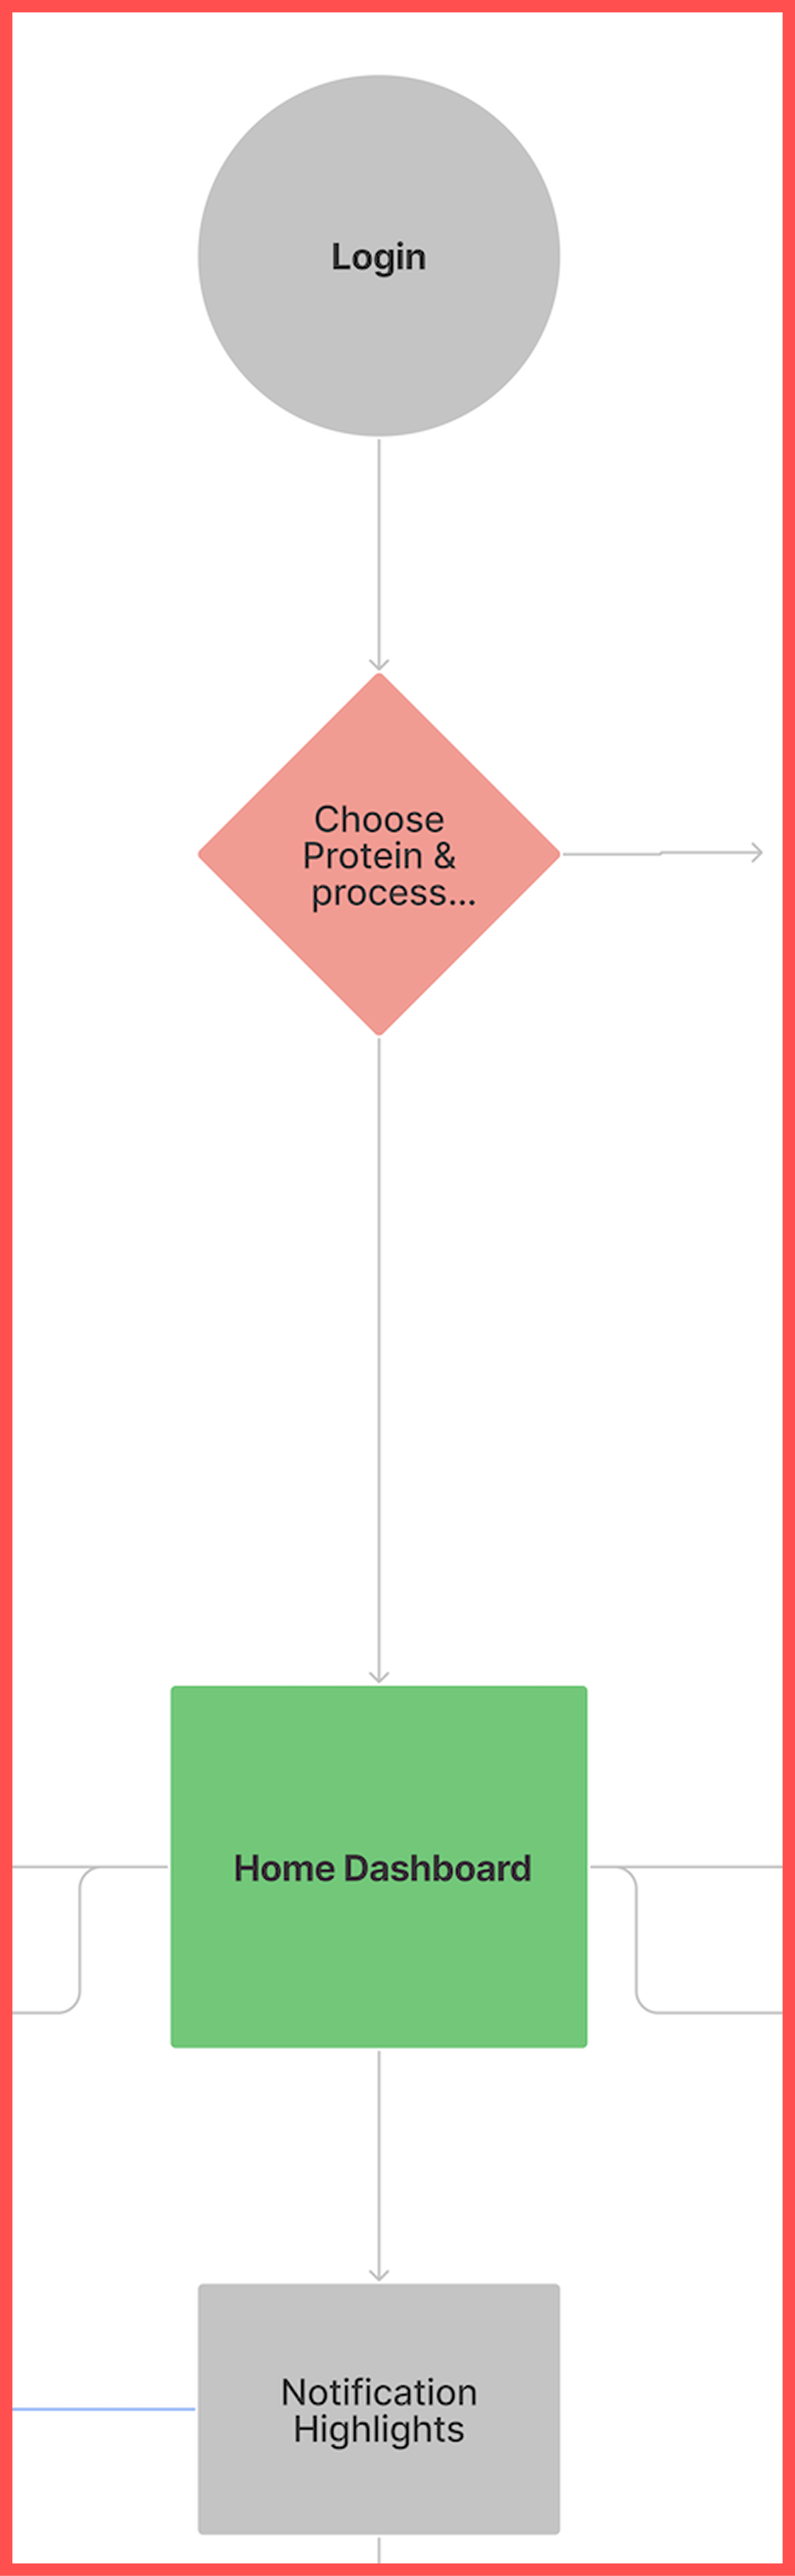
The Home Dashboard would show the following features:
Notification highlights with ability to view more.
A list of customers, ability to expand a facility card to view details, and visit the facility’s profile.
A watchlist of potential customers, ability to expand a facility card to view details, and visit the facility’s profile.
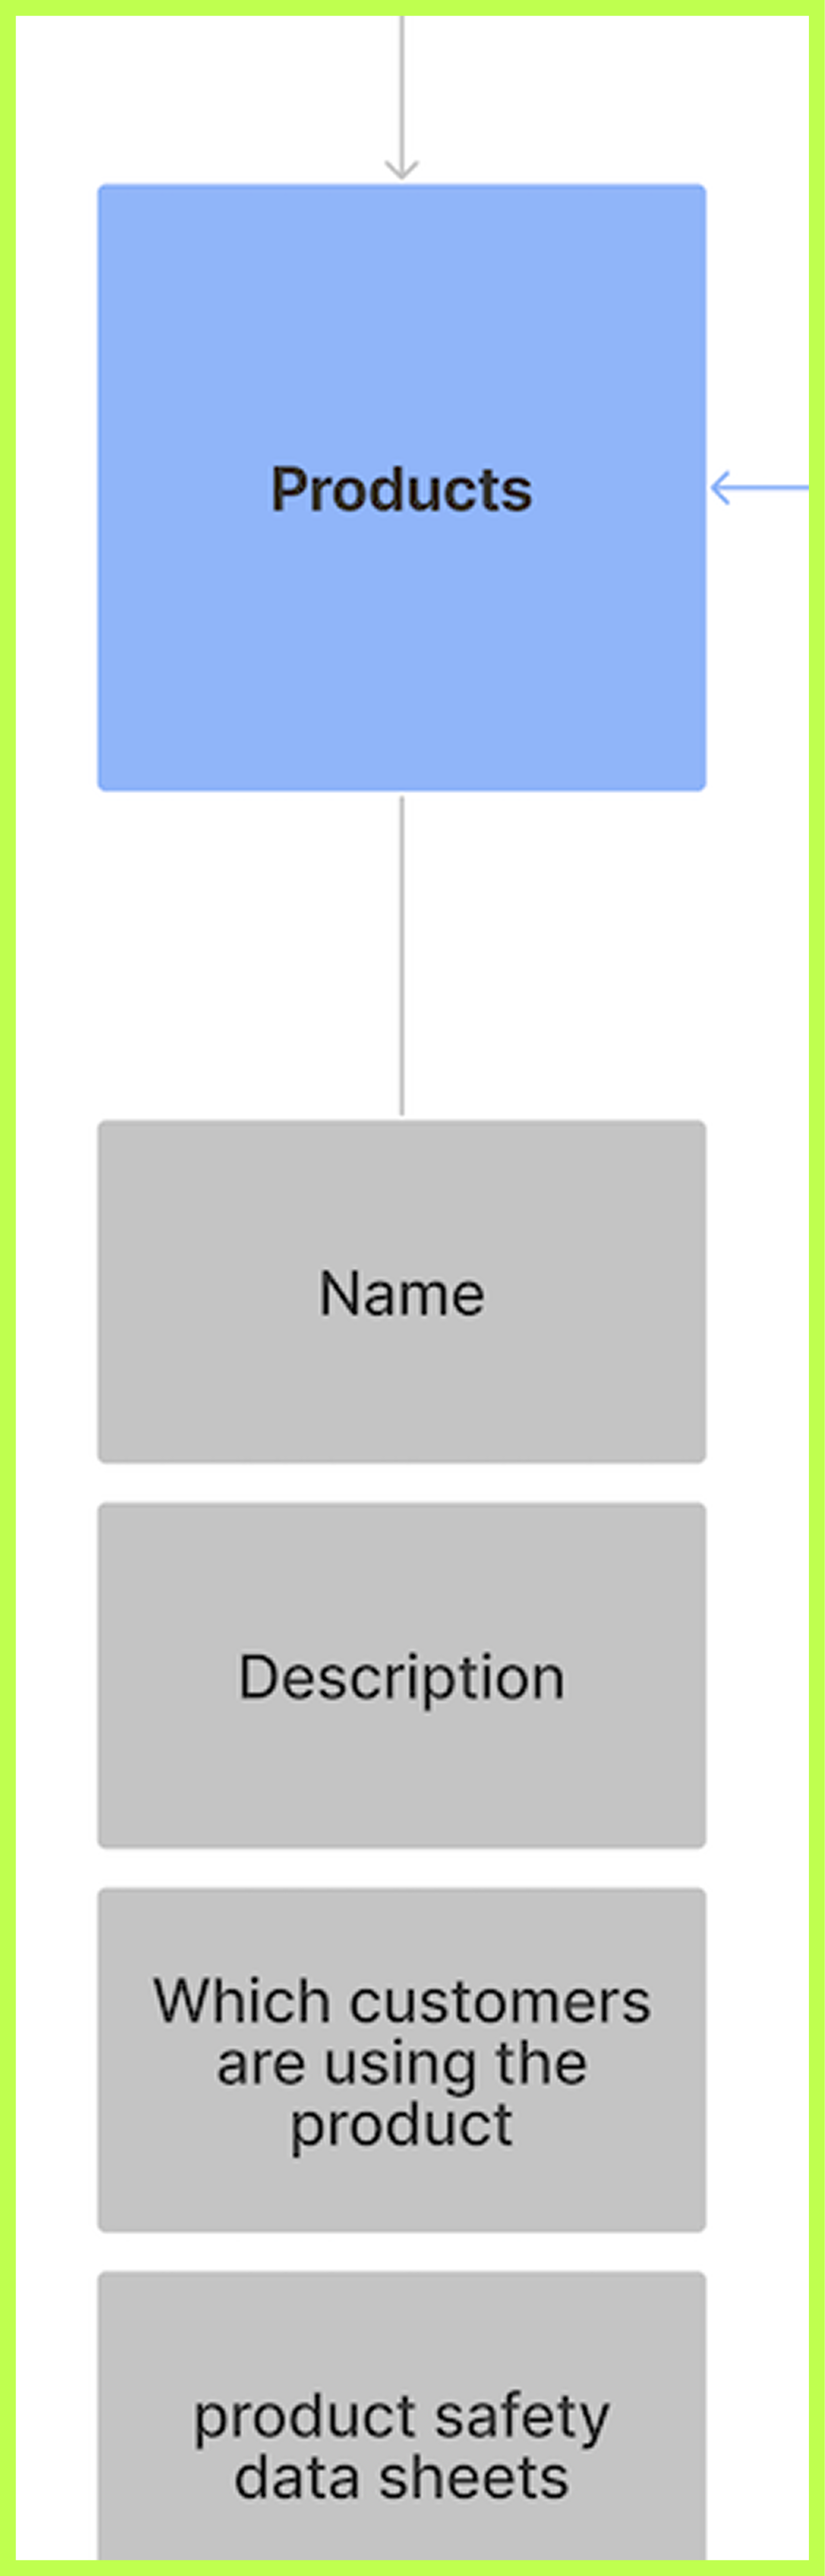
Products and their specifications.
Annotations taken by the user.
The Navigation Bar would contain the following tabs:
Products
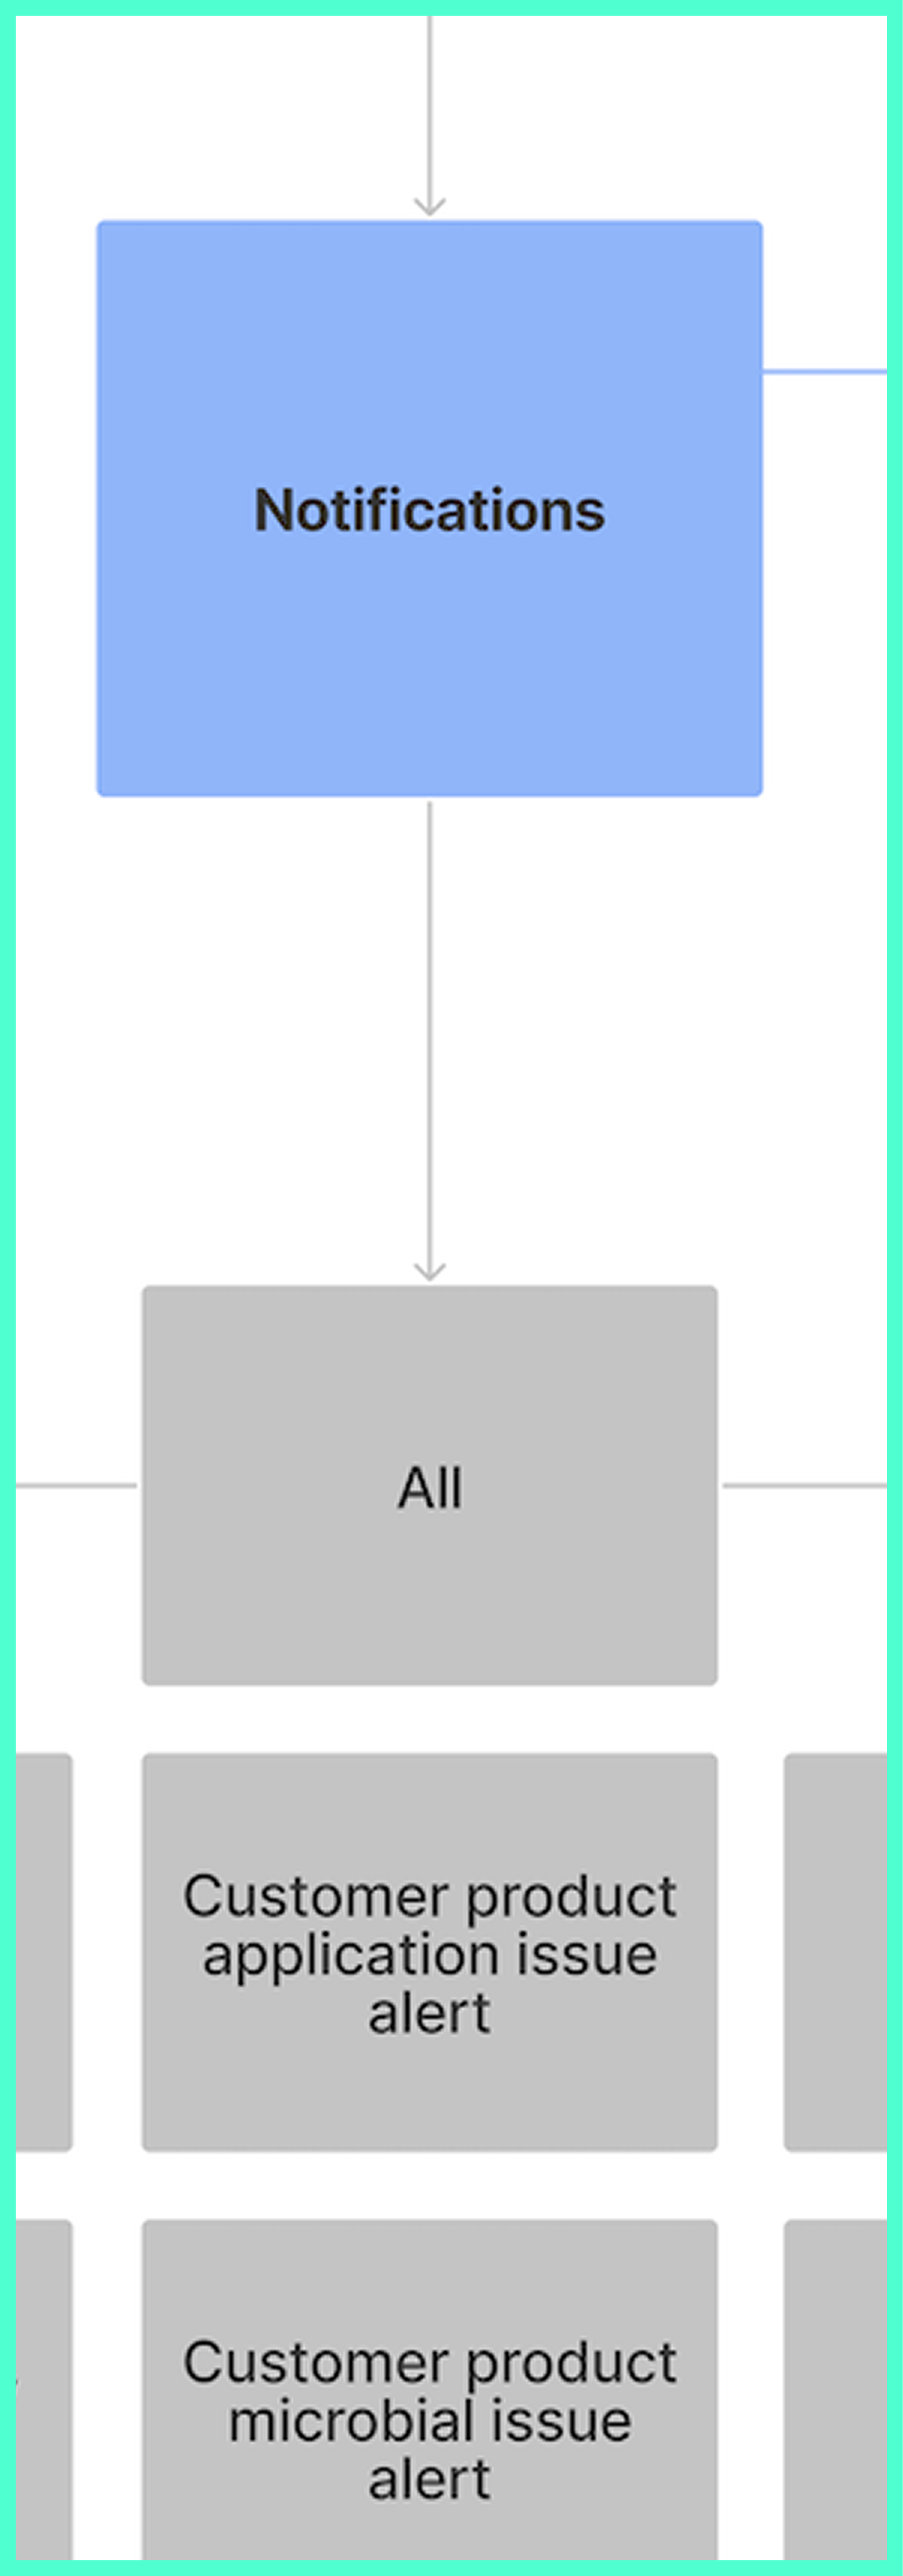
Notifications
Dashboard
Facilities
Discover tool
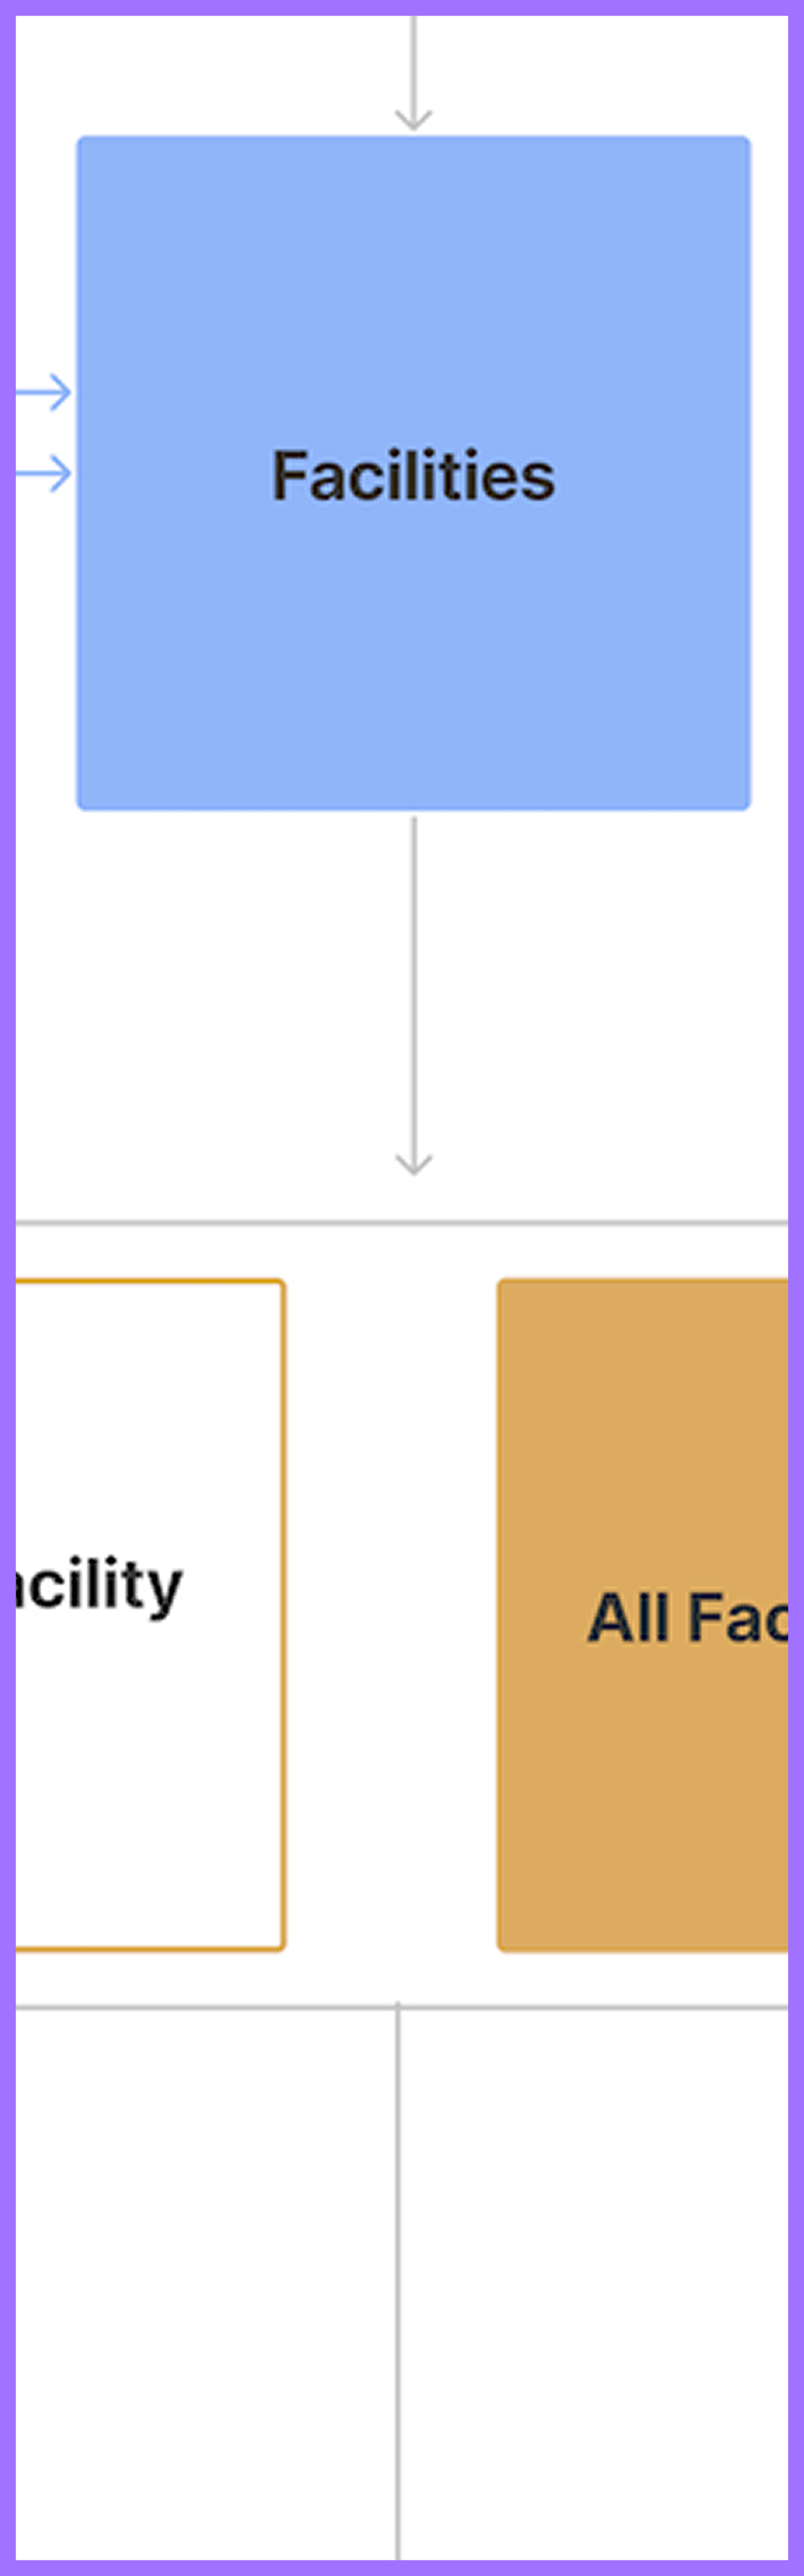
There would be 2 main ways to view a facility profile to monitor performance: either the user could use the discovery tool and select their criteria to find relevant facilities on a map, they can click on the facilities on their dashboard, or access a "facilities” tab in the navigation bar.
We also mapped out the user flows and journeys.
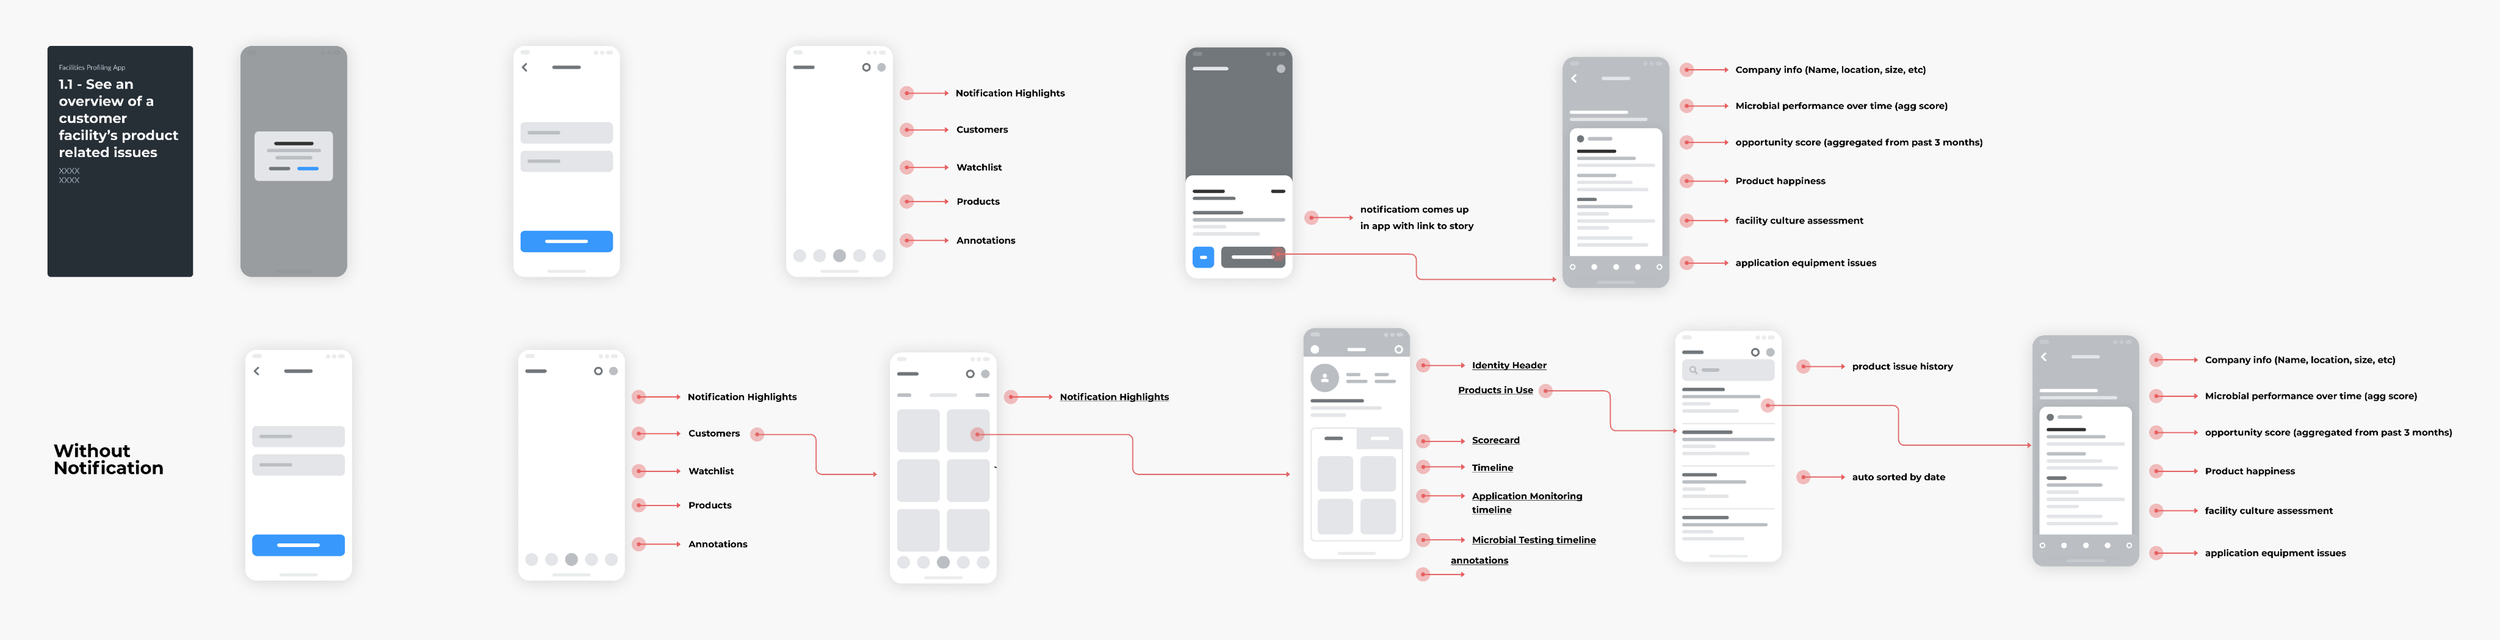
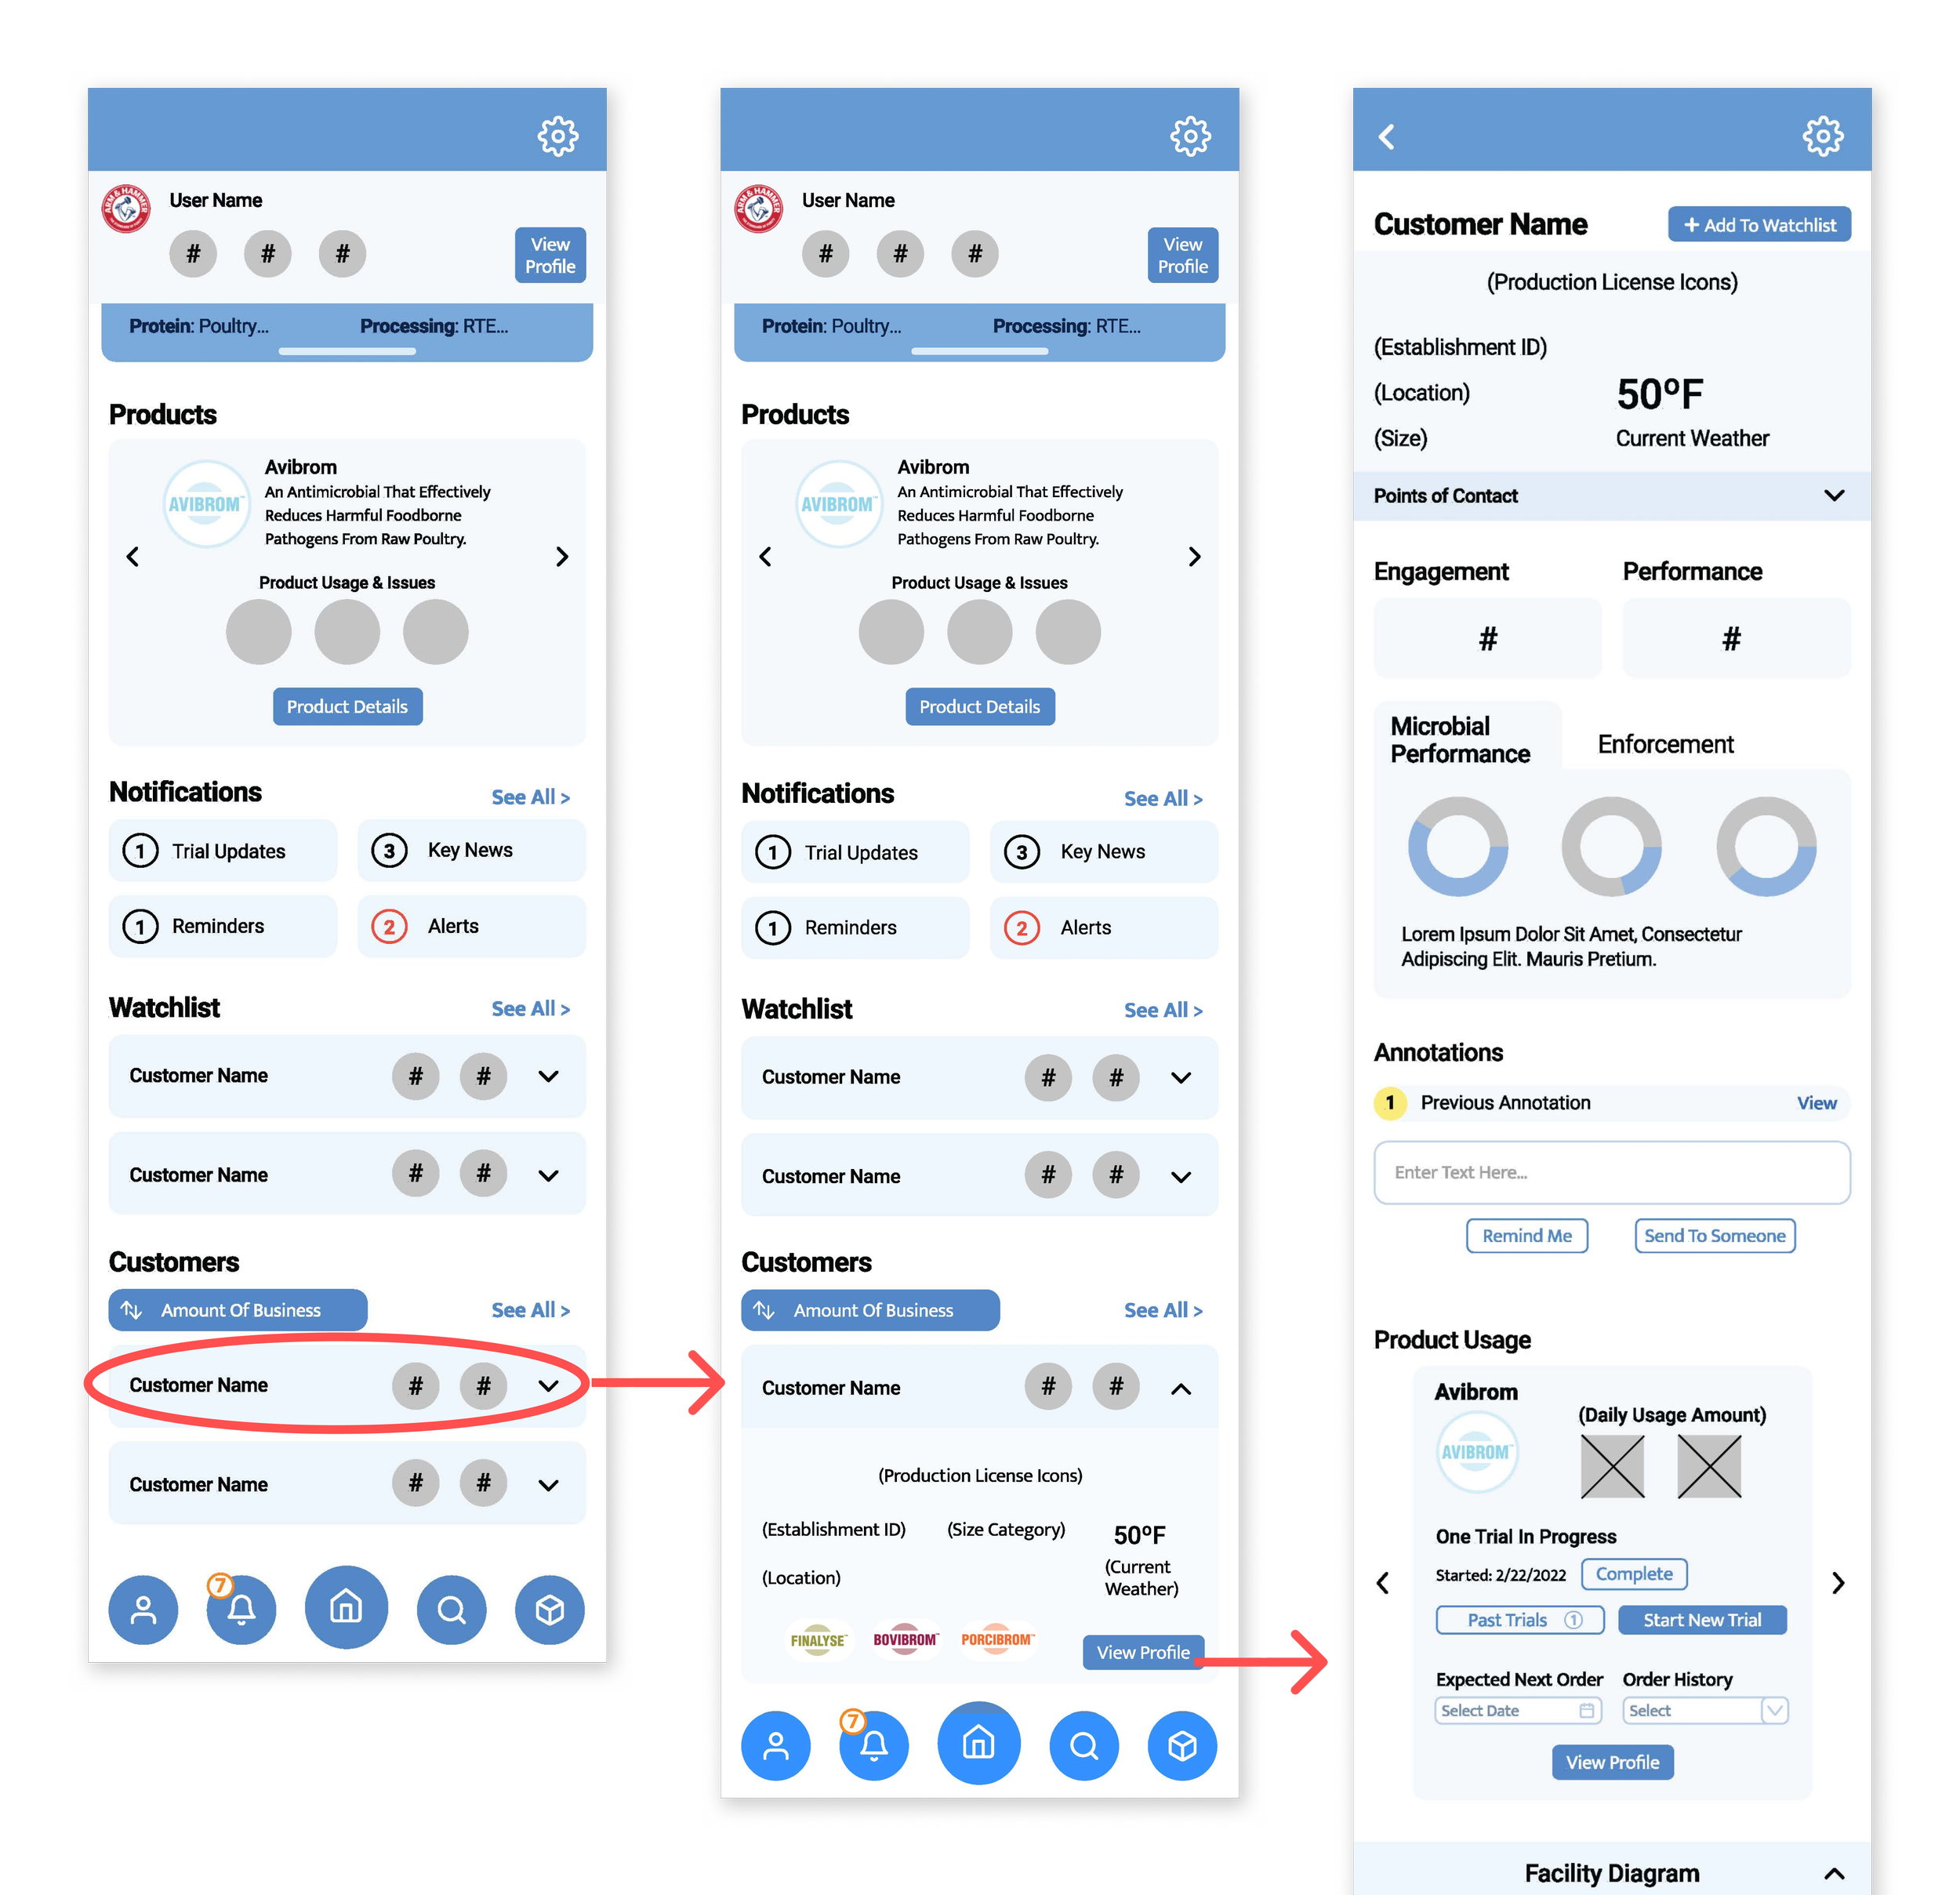
For seeing an overview of a customer facility’s product related issues users would either receive a notification about a facility with a link to its profile, or select a customer via customers/watchlist to visit its profile.
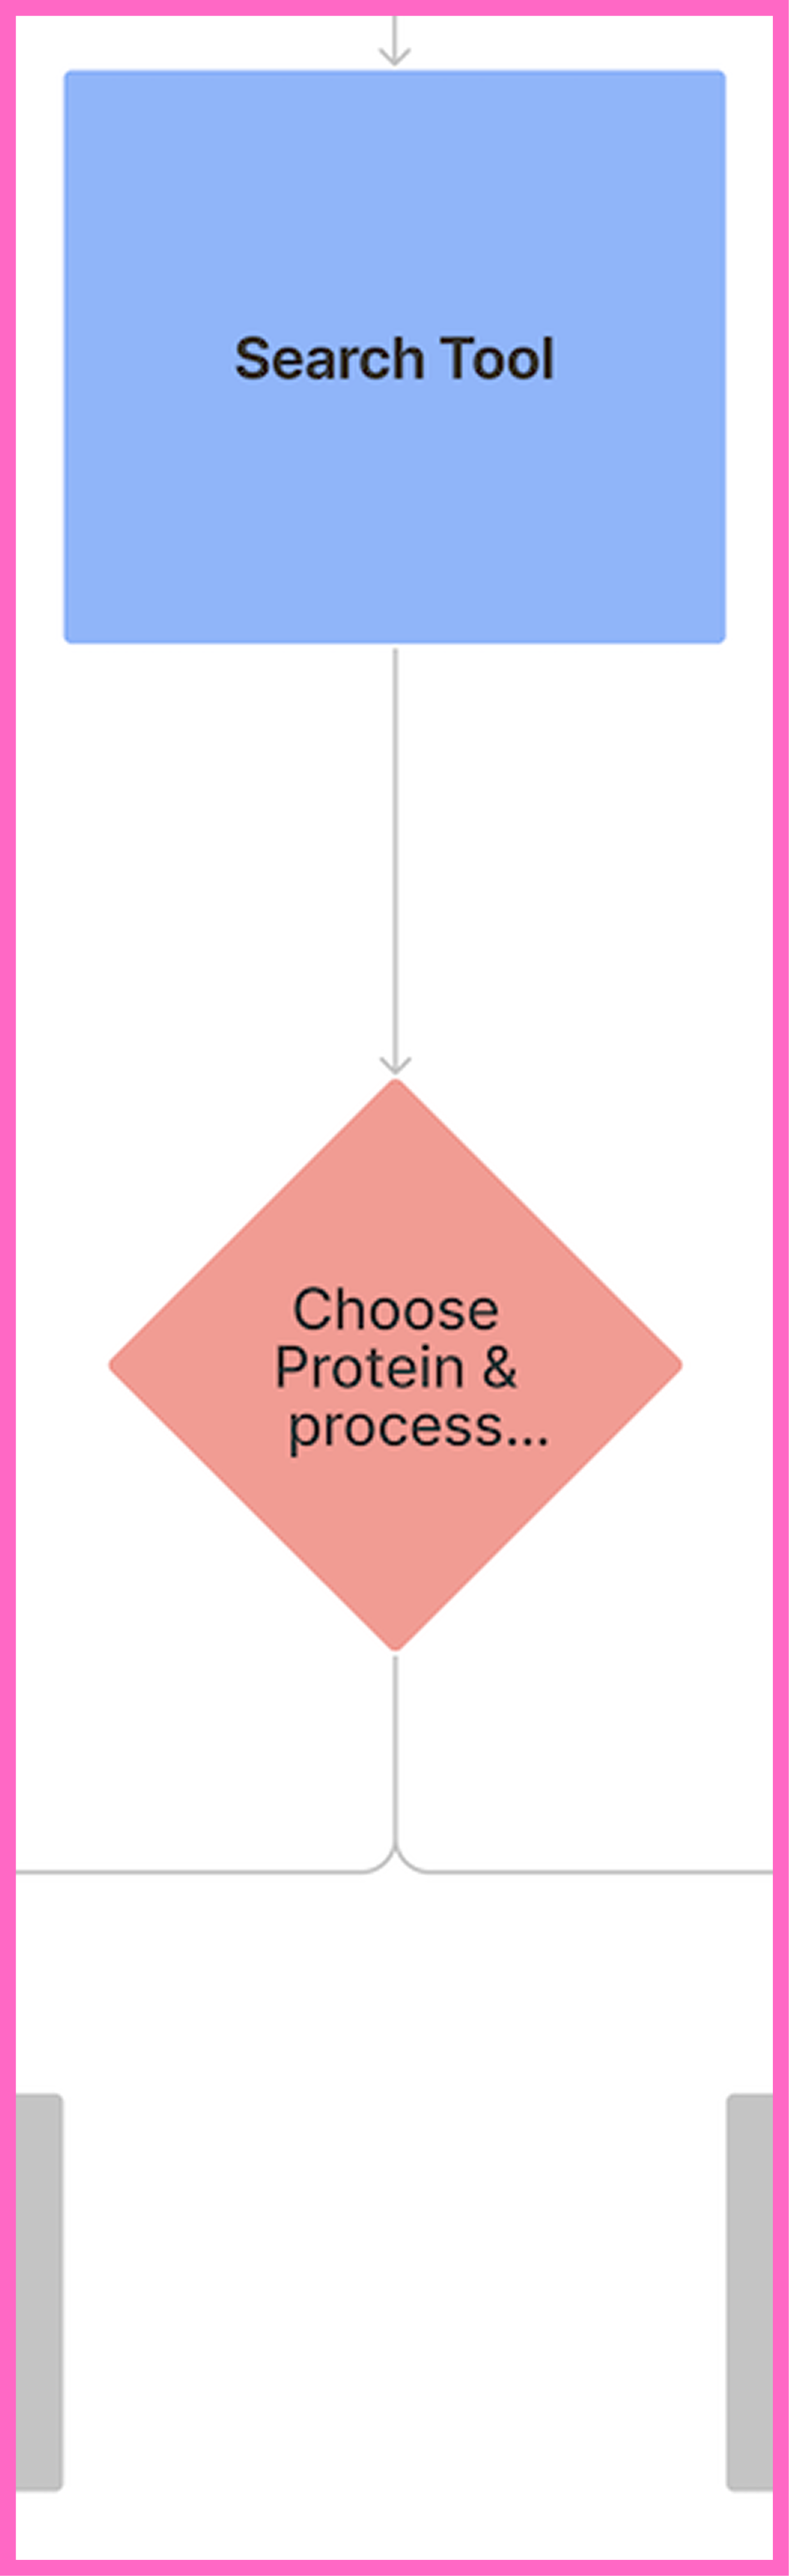
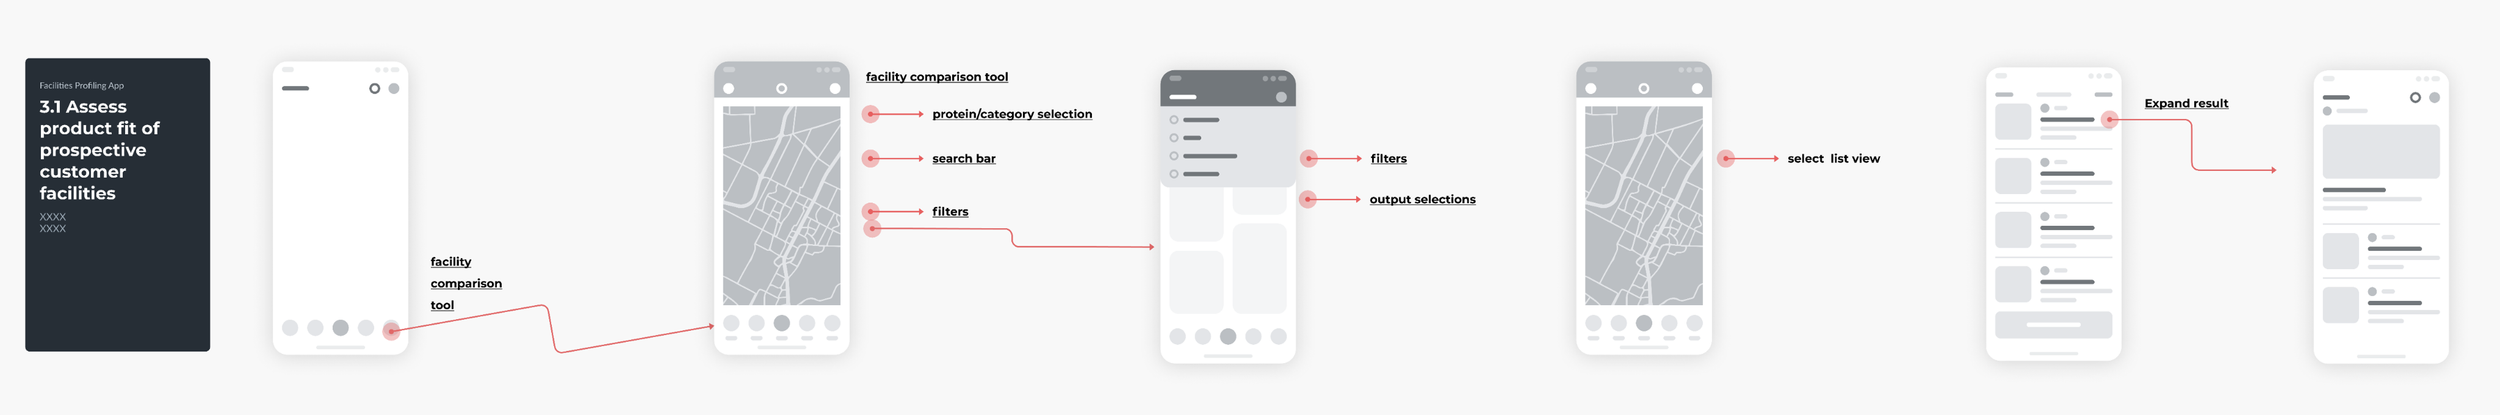
For assessing product fit of prospective customer facilities users would access the facility comparison tool, select their filter criteria, and find facilities in map or list view, and select a facility to see its profile.
Testing & Iteration
While I was unable to convince leadership to do usability testing to track eye movements and understand users’ intuitive nudges, we did provide a demo of the mid-fidelity screens to stakeholders to seek feedback on structure alone.
Stakeholders were not fully satisfied with the dashboard—they liked parts of it but differed on which features were important and relevant to them. They felt overwhelmed by the amount of items on the dashboard, asking why there was both a watchlist and customer list, and noted not needing to see all the info in the expandable facility cards, but just wanted to see some kind of overview for each.
They loved the idea of the discovery map but wanted to see how it would work more specifically. They indicated wanting the ability to see only facilities with specific performance criteria on their dash. And while they liked the idea of the messaging tab, they also felt it didn’t address all of their needs. They also want to be able to filter through industry notification, factory notifications, and other notifications. Products seemed to not be important enough to warrant real estate on the main dash. They also wanted to see at a glance, any relevant information or figures regarding their facilities’ performance.
So we made adjustments to address their concerns with the following solutions:
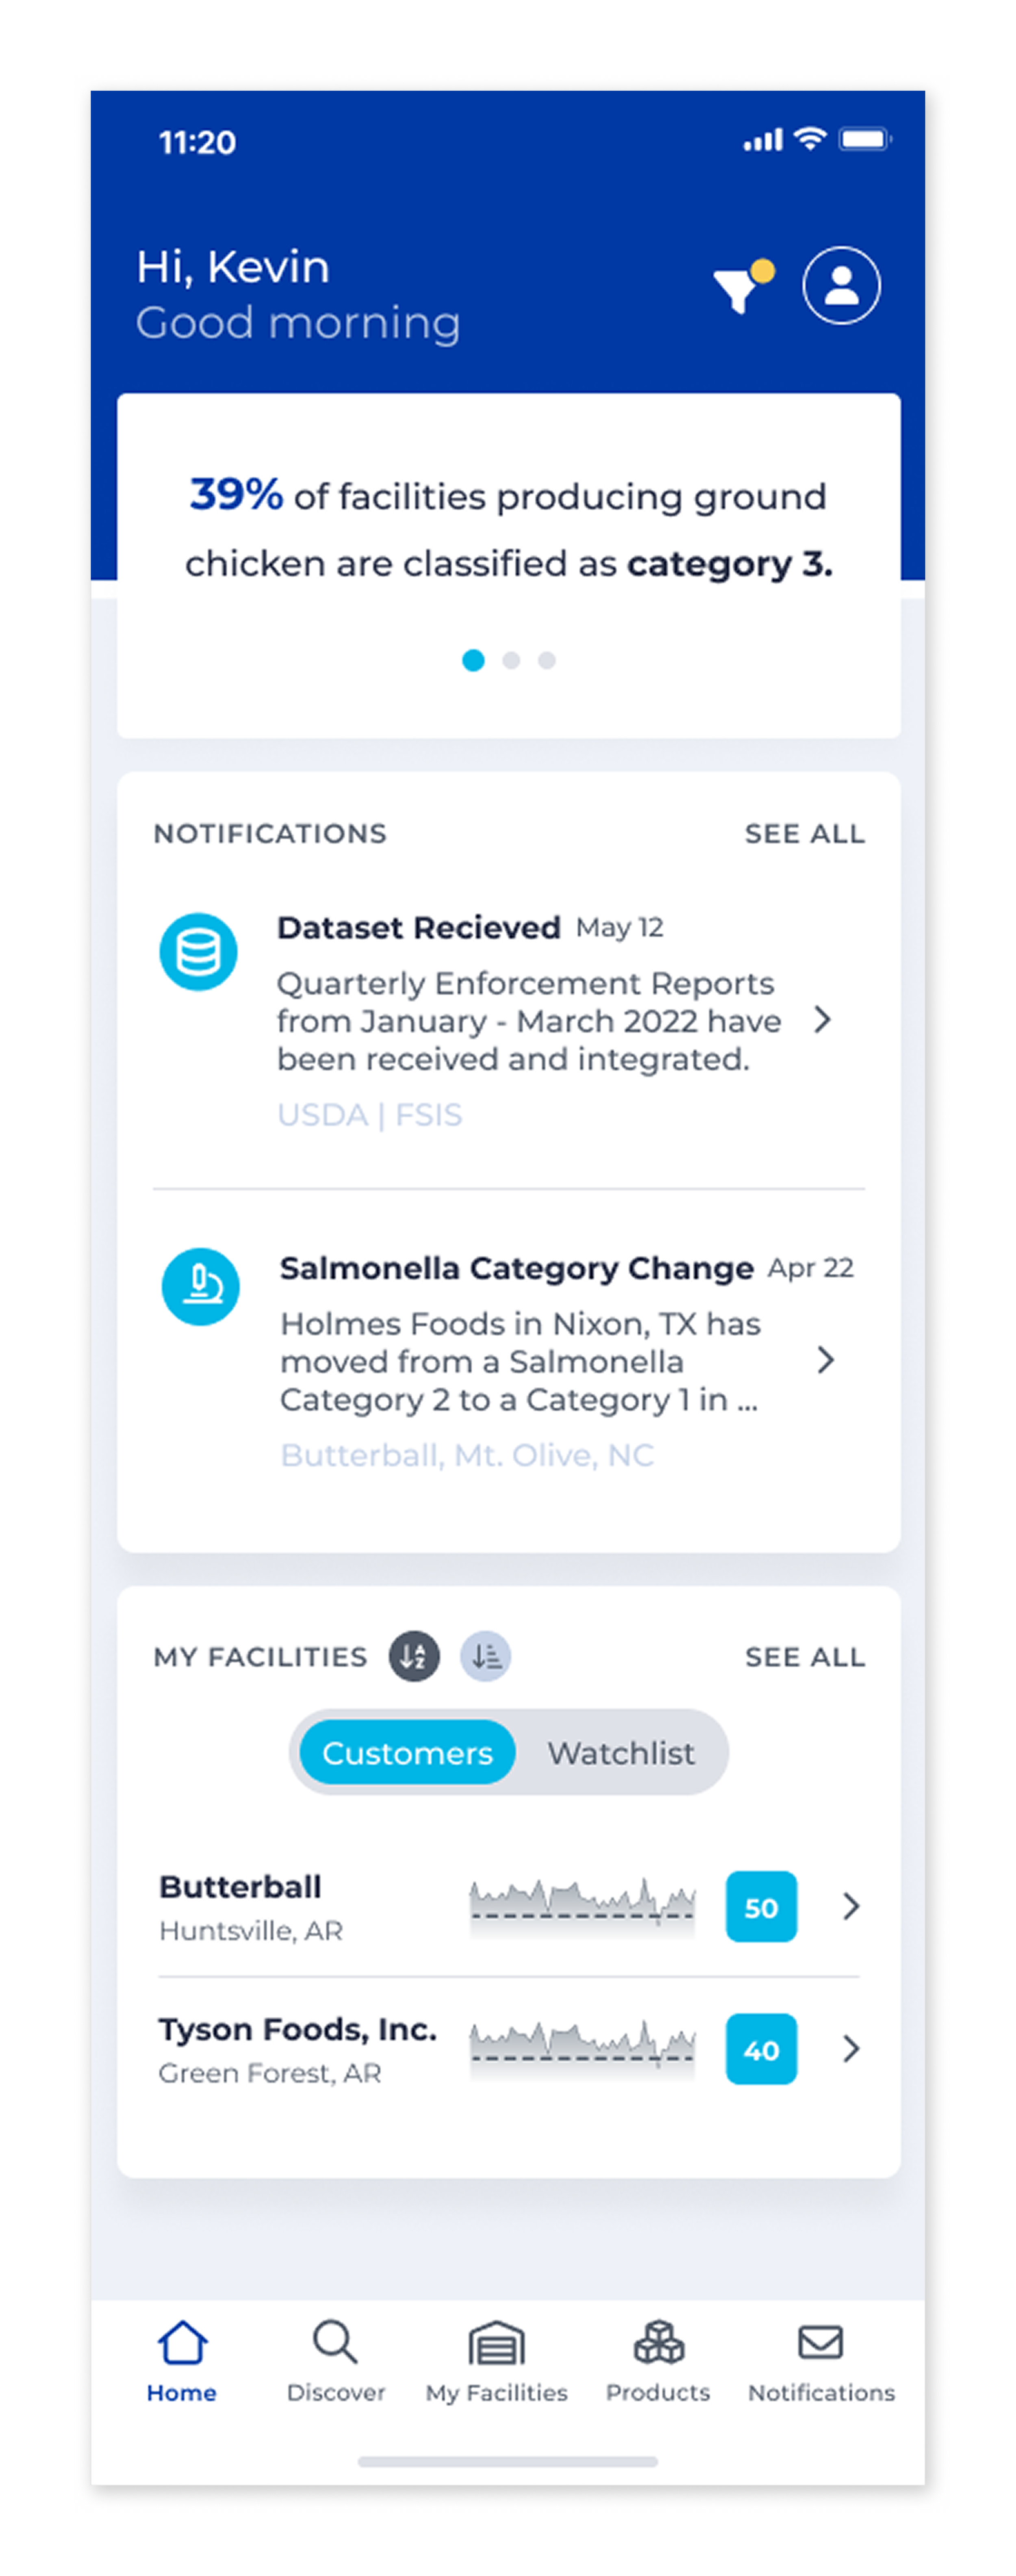
→ At the very top of the page is a slider card with that would aggregate data from facility performance to address the need to see quick facts on their facilities.
→ Just a few urgent notifications are presented on the dash while the rest of the notifications and alerts would be pushed to the messaging and notifications tab.
→ To minimize visual overwhelm, we condensed the watchlist and existing customers into one section with the ability toggle between customers and watchlist.
→ Each facility now only displays the facility name, location, and a big picture timeline graphic with a performance or opportunity score.
→ Since they want to be able to see only facilities with specific performance stats on their dash, we gave users the ability to filter by facility type or ranking criteria in the initial selection.
After conducting another demo, stakeholders approved the structure. They appreciated the streamlined dashboard, with the ability to find facilities either through the discovery tab containing the filterable interactive map, through a list of the facilities they have already saved to the “my facilities” tab, and through the ones the “star” for their dashboard.
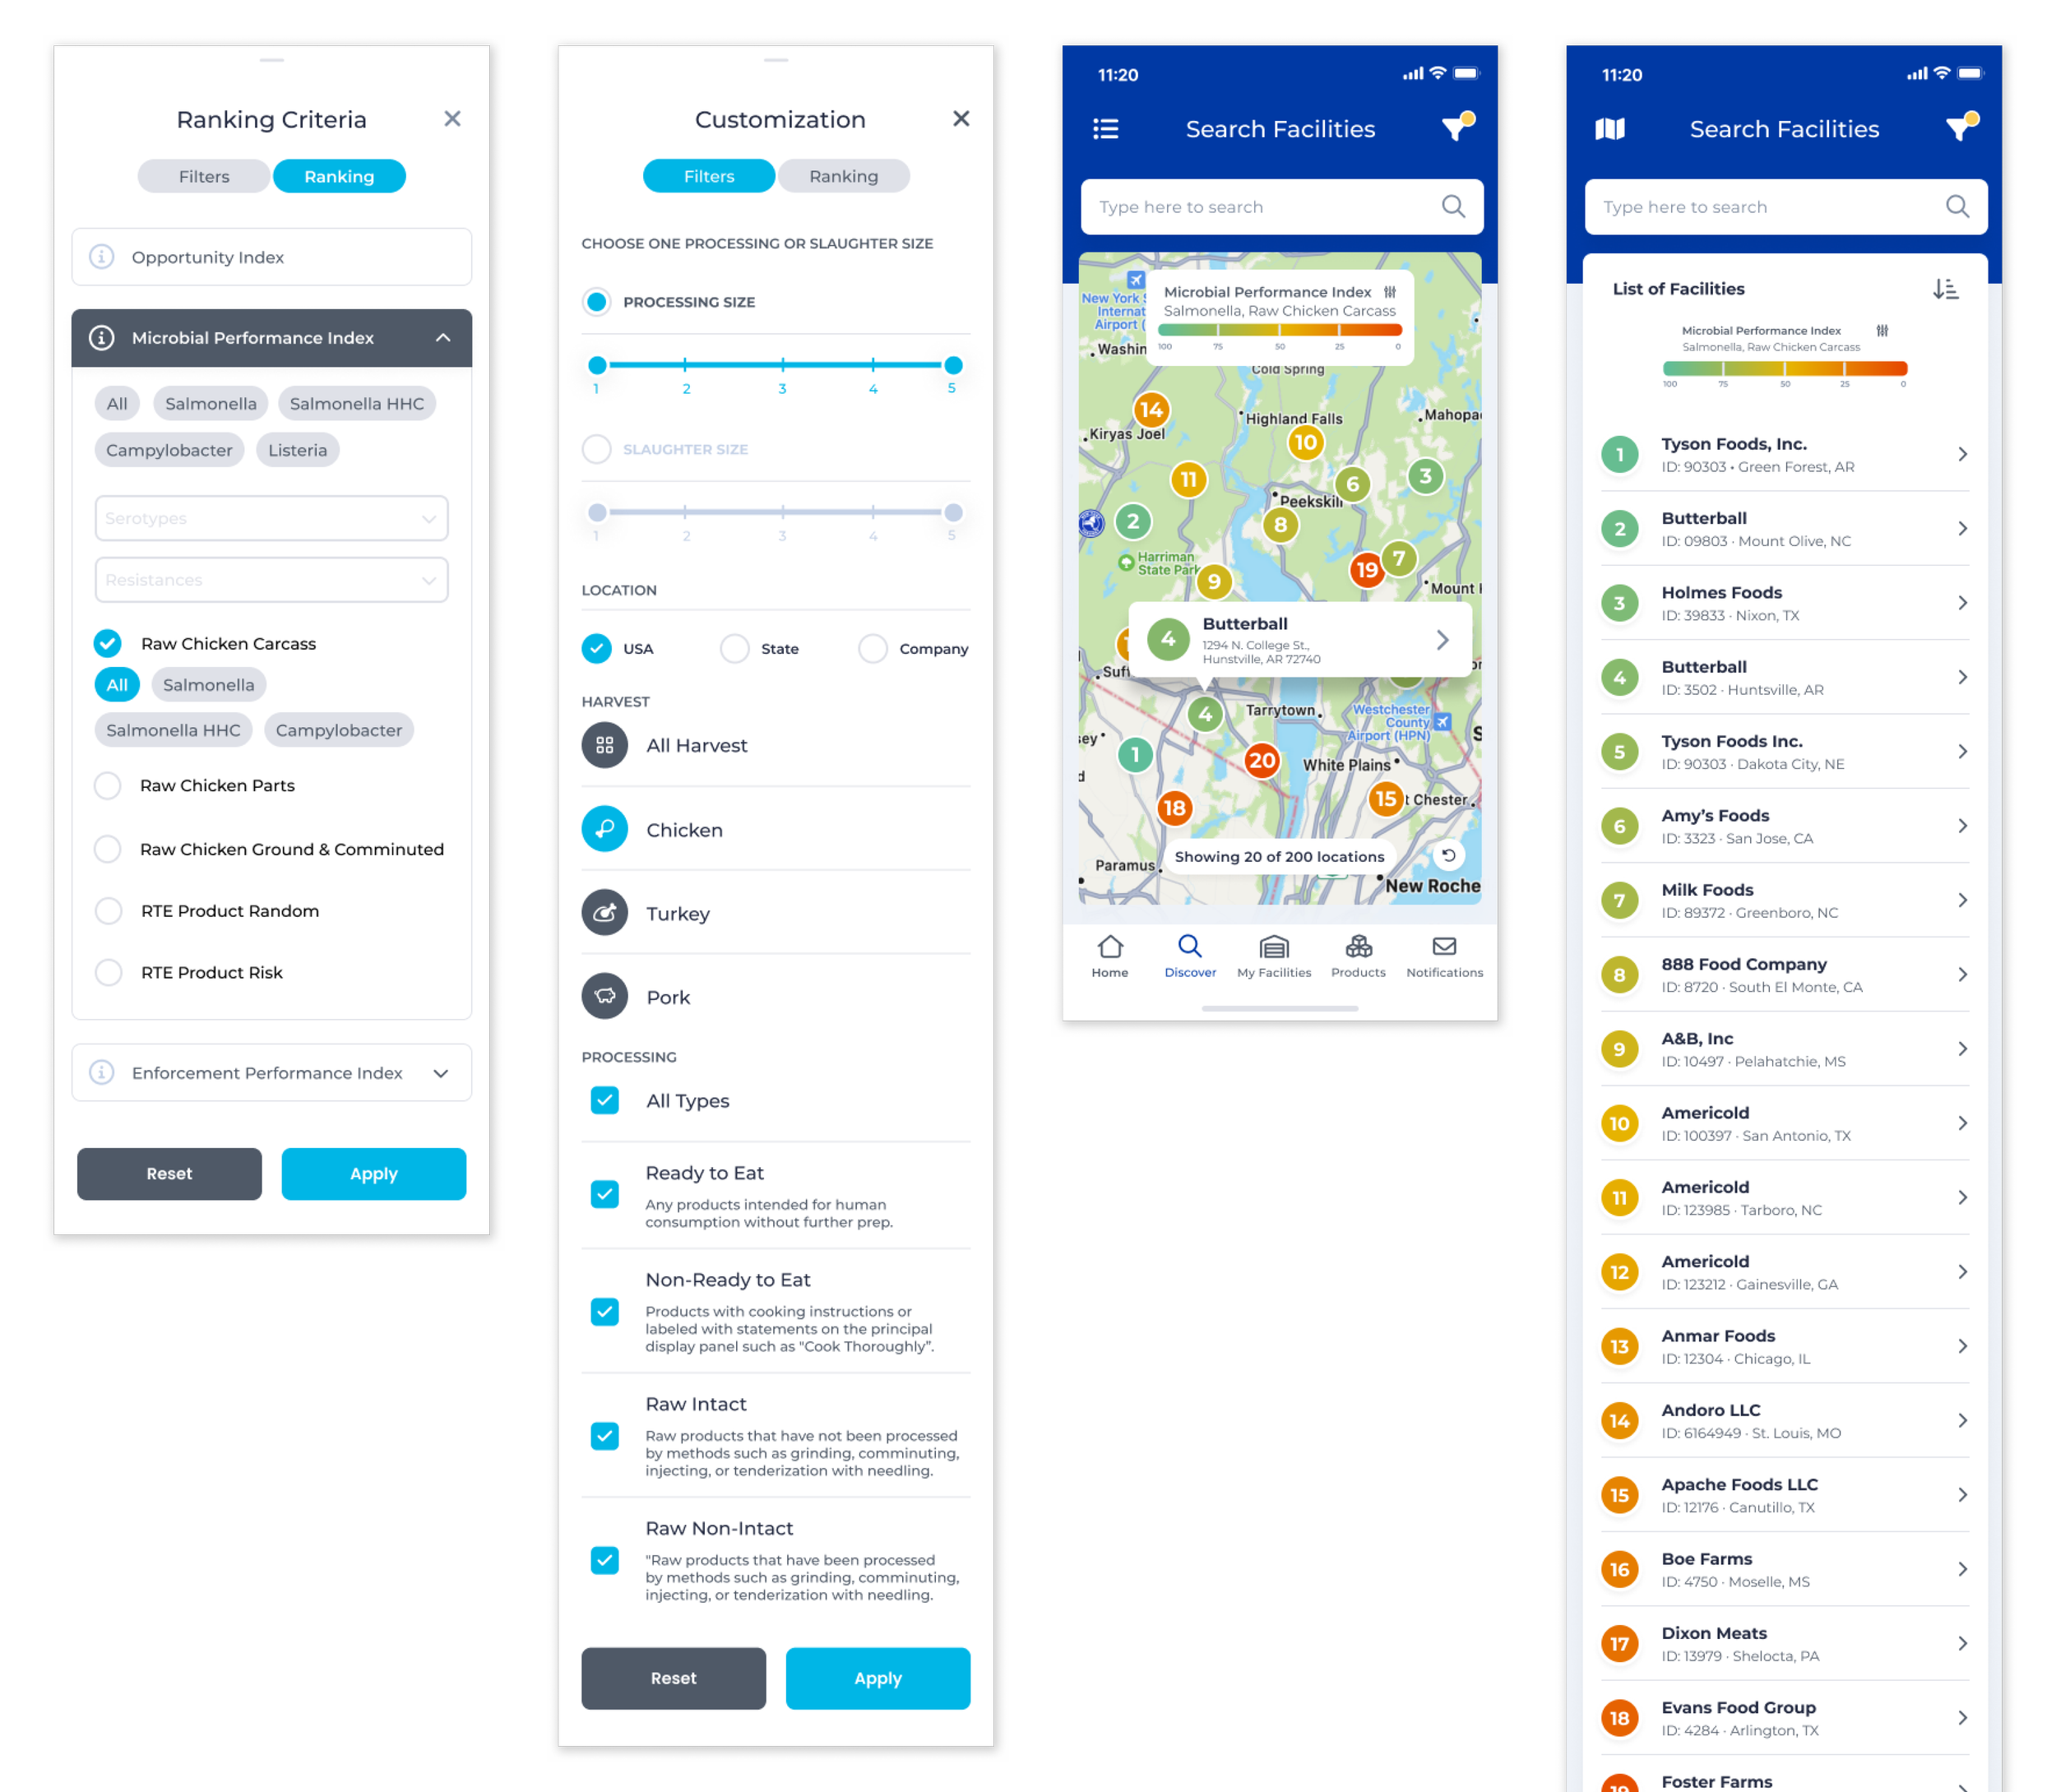
Being able to filter by facility type (facility types, size, and location) or ranking (opportunity index, microbial performance index, and enforcement performance index) within the discovery tool (search tab) gave them the control and finesse they needed to search for facilities within the confines they deem relevant.
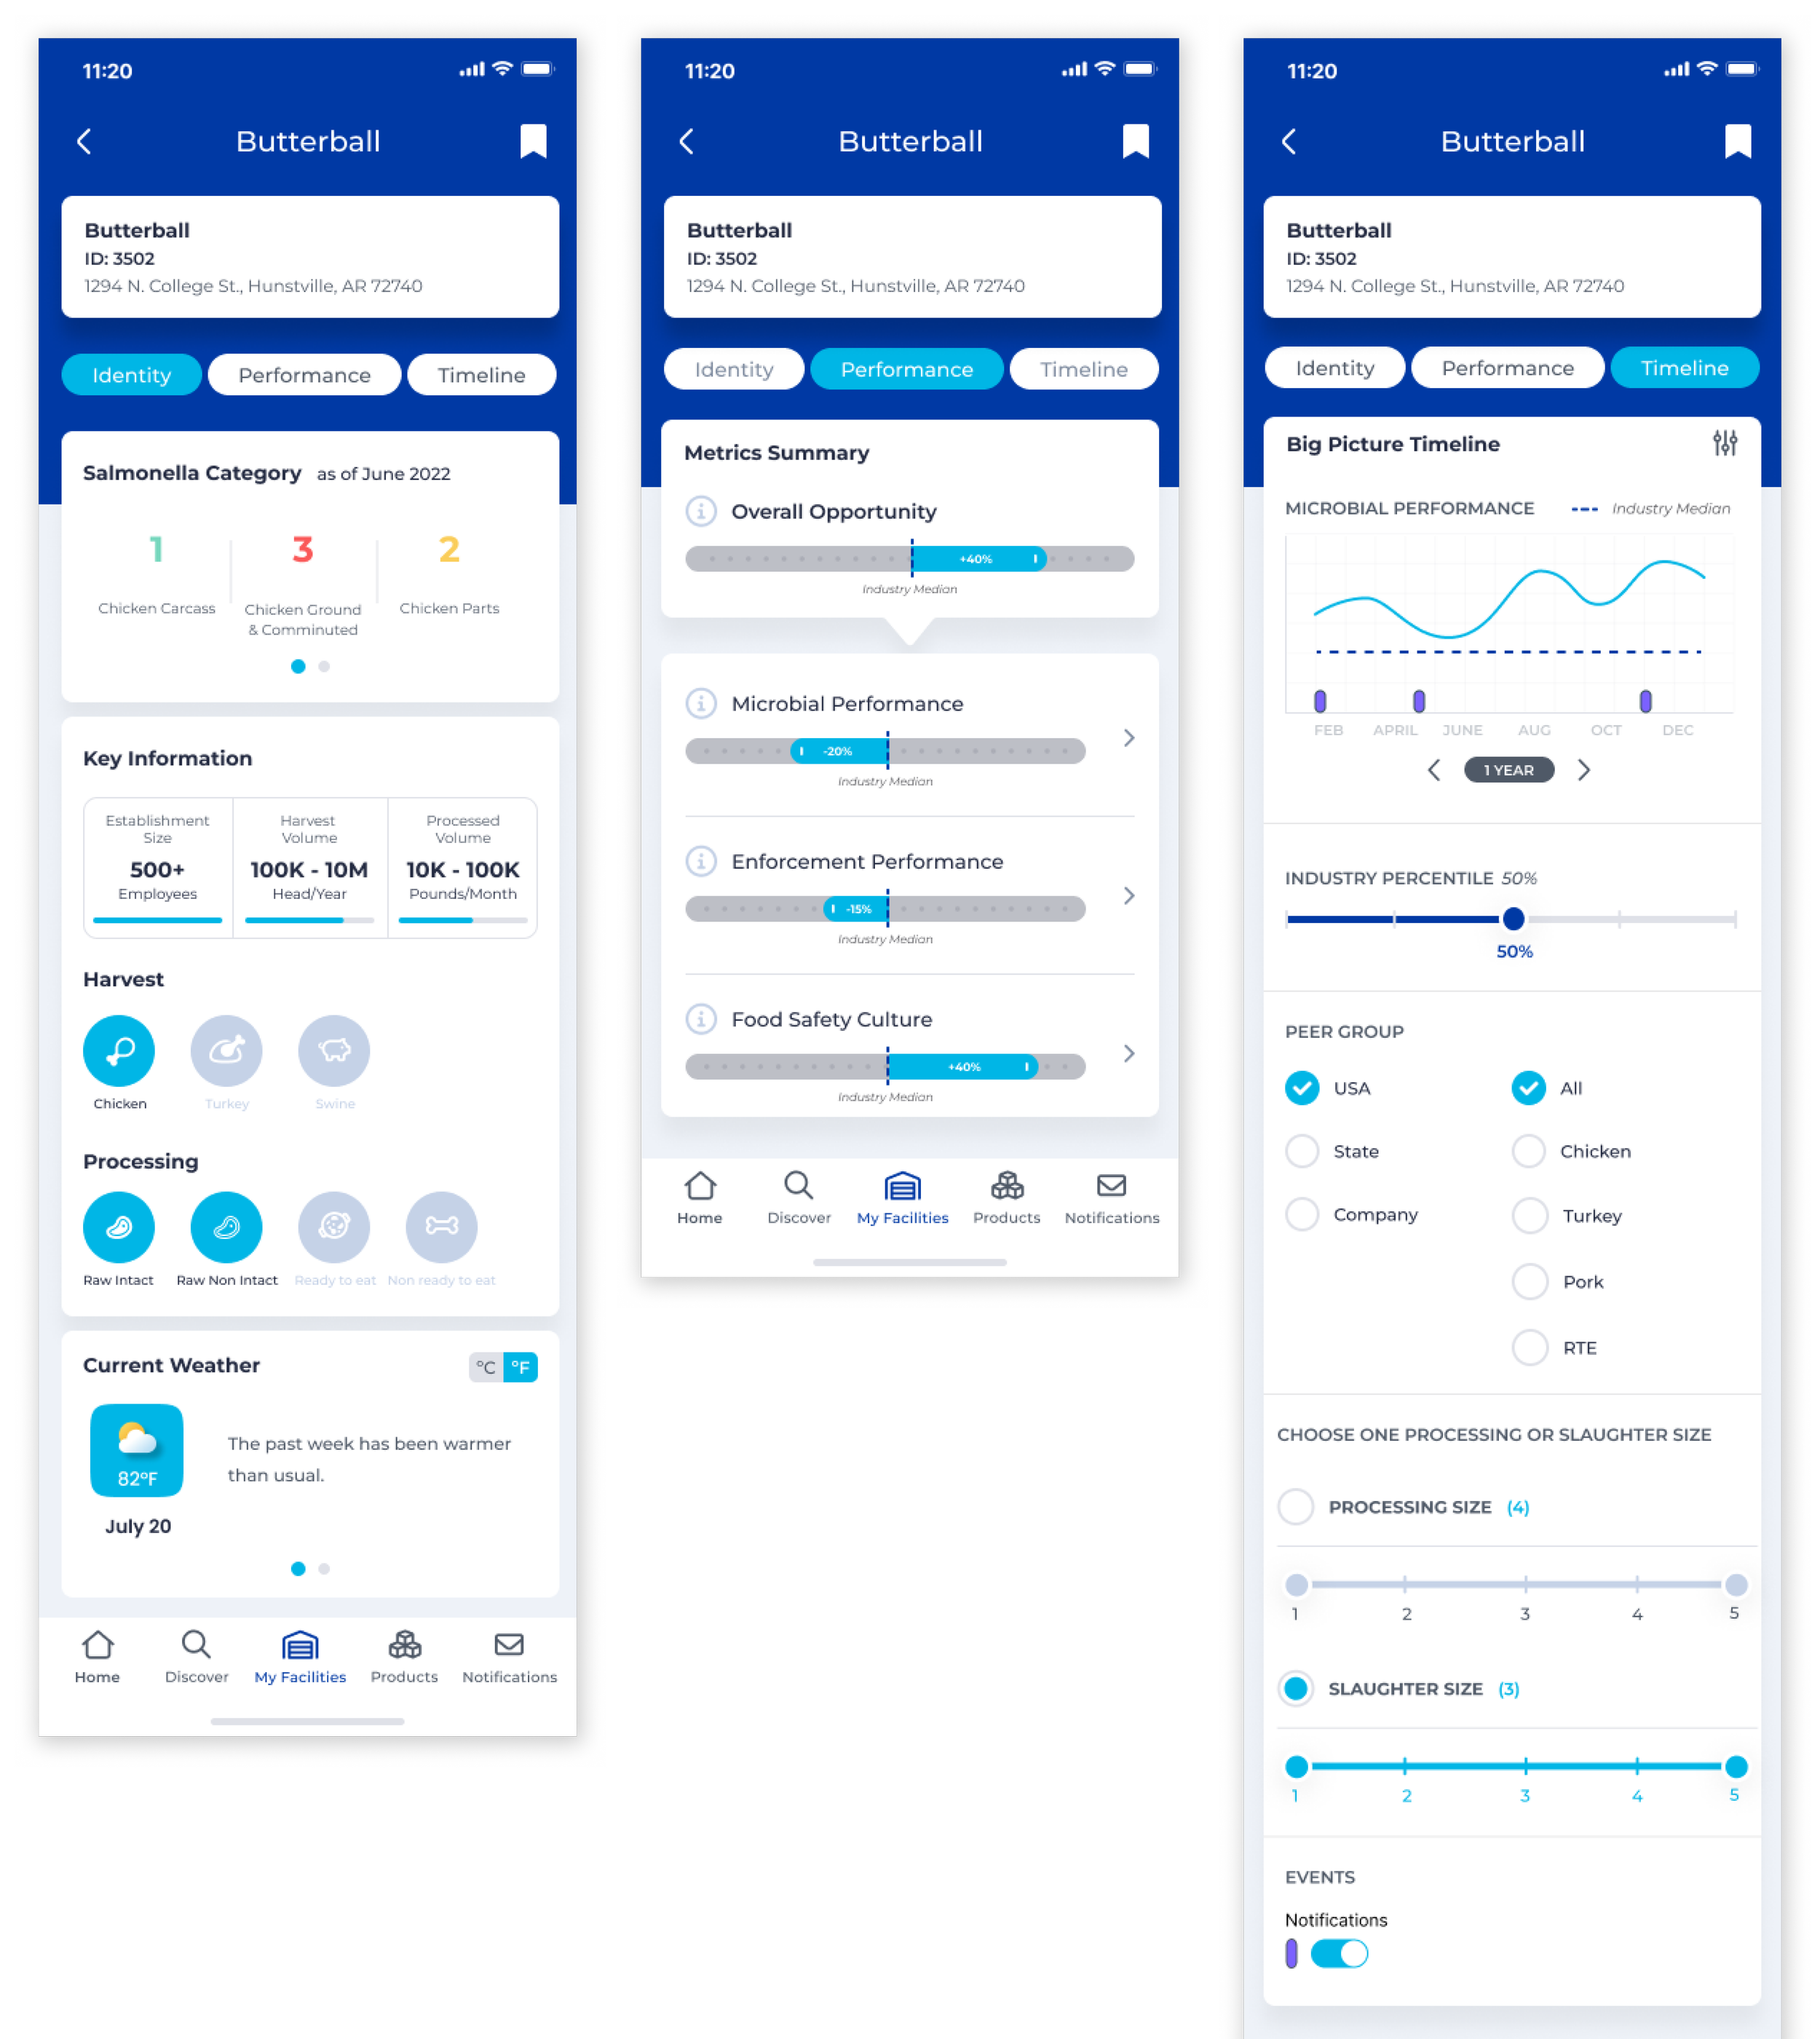
Once they select a facility, they can then view that facility’s identity facts, microbial performance, and big picture timeline, giving them information needed for deeper dives and facility research.
Final Product
We incorporated final feedback into a revised MVP, which launched in December 2022 with the following features:
📲 MVP Features
Onboarding flow for new users
Dashboard with industry alerts, customer performance, and personalized filters
Discovery tool with customizable search filters (protein, process type, serotype)
Facility profiles with performance timelines, percentile comparisons, and culture results
Watchlist & My Facilities to track high-priority accounts
Notifications for new datasets, recalls, and status changes
Product page with all offerings listed in a separate section
Outcomes
I left the company shortly after launch, so I haven’t been able to see performance data, but if I did here are the key metrics I would look for to diagnose success:
To track User Acquisition & Initial Launch Success, I would look for Downloads & Installs, app store chart rankings and conversion rates of store page views to downloads, and user acquisition source (organic, paid, social) to identify effective channels.
For Engagement & Retention, checking the Number of unique users engaged daily vs. monthly, the ratio of how many of those user types return, percentage of users returning after set milestone dates, and session length
App Performance & Stability would be indicated by crash rates, screen loading times and requests, and memory or battery usage.
User Behavior & Monetization: If users are dropping off during onboarding or task flows and the rate of drop-offs, average revenue per user, and predicted revenue per user.
This project was a great lesson not just in visualizing and simplifying complex data into an elegant user experience, but also in: learning how to be an advocate for users when up against unyielding leadership, how to create allies that will vouch for your ideas, how to communicate in the language of various roles (engineering, leadership, stakeholders etc.), and show the value of utilizing UX research techniques from the get-go instead of mid-project.
Want to know how I introduce clarity to chaotic cultures?
Discover my signature C.L.E.A.R. framework—built for real-world UX in startups and low-UX-maturity orgs.
You can read more about it here.